
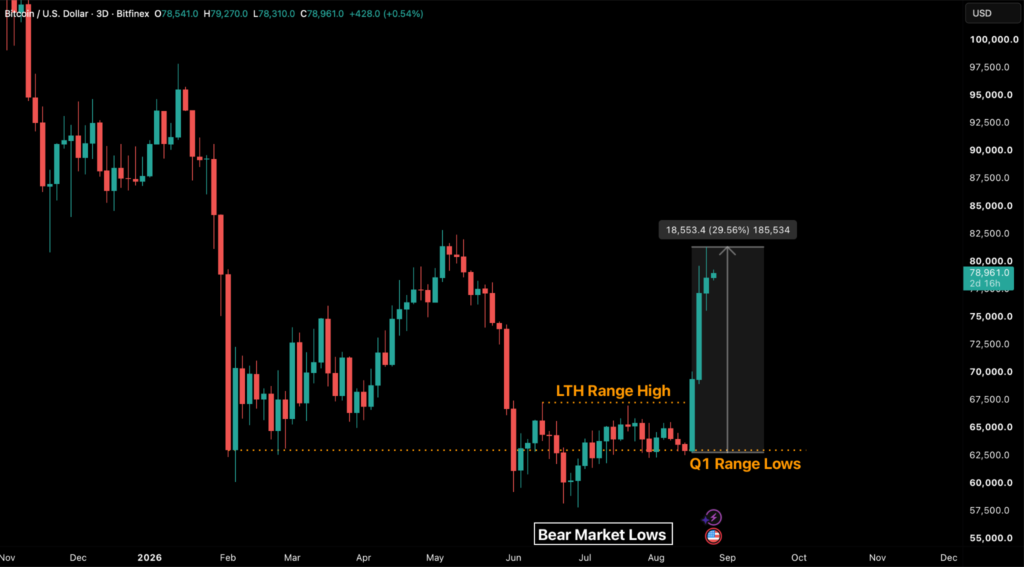
The ten-week range between $62,000 and $67,000 ended on 19 August. Bitcoin tested the range lows on 17 August and broke above the lower timeframe range high by 19 August, a gain of 11.7 percent across three sessions and the largest three-day advance recorded in BTC in more than a year to reach $70,089 at the end of that streak and the follow through on the breakout helped price reach $81,300 as our latest high for this uptick on 25 August. The move has since stalled at levels seen last May, when between 4-15 May, the market closed 12 consecutive sessions between $78,000 and $82,000, with a high of $82,818 on 6 May. It then rolled over into the drawdown that ended at $57,803 on 1 July which is our bear market low.
Overall the price is up more than 29.5 percent off the range lows, which have now been repeatedly tested.
What is different this time is the speed of the rally and the fact it has been powered by aggressive spot buying instead of perpetual positioning coupled with price-agnostic treasury buys. Where there is similarity is where the price has stalled.
Volume profiling based off options strike prices puts the band where there has been the highest volume traded, above $80,000 at around the $81,067 level. This week’s highs of $80,008 on Monday and $81,300 on Tuesday were both sold back inside that band, and price sits under the level as we speak.
When large trades are executed around a certain level at a specific time as seen in the chart above, the resistance level is often the same.
Based on the same logic, the highest traded level above the range highs is now the $77,100 level.
During the May breakout, this was the level that price tried to retest as support, before continuing higher, but failed to do so, and instead became a resistance level on the way down.
In the short-term therefore, we can expect price to re-consolidate between these important levels between $77,100 and $80,000, before either continuation of the move or a break below the lower level at which point ETF and treasury flows become more important than the price print to gauge future direction. However, if the spot buying aggression seen so far this week from the ETFs as well as the lack of break-even selling previously highlighted continues to persist, we can expect continuation above $81,000 on positive catalysts.
The advance in BTC has been helped by forced short covering, financed by seven consecutive days of spot ETF inflows, and it changed the identity of the marginal seller: holders of BTC for 155-300 days who were previously realising losses just 7-14 days ago are now realising profits, and at a lower intensity than when they were booking losses.
We now have a squeeze that has run into a defined population of sellers but with a genuine bid underneath it. This leads us to believe that a potential lower timeframe range, or a continuation of the move is likely. A catalyst that can bring this into effect is Friday’s Jackson Hole keynote from Fed Chair Warsh.
How the Range Ended
Institutional appetite followed last week’s historic short squeeze. BlackRock’s IBIT recorded net inflows above $500 million on 20 August, a level of daily absorption last seen in January 2026. While funding rates have also trended higher, the current breakout was driven by spot buying aggression rather than leverage, confirming our view that the market is still positioned positively, with upward momentum intact for now.
The 14-day moving average of the long-to-short liquidation ratio has dipped below parity for the first time in 11 months. Sustaining the breakout calls for BTC to consolidate at current levels while the altcoin complex capitalises on the broader tailwinds.
Provided these structural conditions hold, the path for further follow-through remains open.
Who is Buying?
The spot ETF complex supplied the taker spot demand that carried price higher over the past week and continues to support price above $77,100. US spot Bitcoin ETFs took in $1.92 billion across the five sessions from 17 August to 21 August. Every session was positive and the week recorded the largest weekly inflow since 10 October. ETF flows on 24 August and 25 August have added $337.6 million and $314.3 million respectively, extending the run to seven consecutive positive sessions and roughly $2.57 billion in total inflows.
This marks the full positive week, with IBIT a key contributor — one of our earlier established indicators for confirming a reset.
Converted at the prices paid, the five-day week absorbed close to 28,000 BTC, about 12 times the coins mined over the same period. IBIT’s share volume on the day of the breakout on 19 August reached $4.4 billion, close to five times its August average, which is the footprint of new allocation of shares, rather than of basis traders rolling existing positions. A total of $2.2 billion went into digital asset Exchange Traded Products (ETP) globally in the same week, enough to return year-to-date bitcoin product flows to positive. The pattern reads as a macro allocation decision, with softer inflation and weaker payrolls stripping out the rate hike premium.
The corporate treasury complex, the second demand engine alongside ETFs, did not participate in the move at all. Strategy’s most recent 8-K filing records $2.01 billion raised from 18.3 million common shares sold, with no bitcoin being bought or sold for an eighth consecutive week. Strategy’s USD reserve is now $5.10 billion with a newly created $1.59 billion pool whose stated uses include bitcoin acquisition.
The firm has rebuilt its balance sheet capacity to buy, but has left it unused, so the largest corporate holder remains a potential buyer. The new USD pool also provides Strategy room to time its purchases, which should reduce the downward pressure on price created if in future it decides to sell some BTC if it needs to rebuild a depleted cash reserve.
The Altcoin Leg
That the advance in crypto asset prices has been broad is a feature that separates this week from the May leg higher. Of the 20 largest liquid altcoins, 19 gained more than 12 percent between the 18 and 25 August closes, and the dispersion above bitcoin’s 21.4 percent gain provides the most telling indicator. Zcash gained 50.9 percent, Aave 44.7 percent, XRP 43.3 percent, Hyperliquid’s HYPE 36.2 percent (a new all-time high) and Ether 27.4 percent percent. Solana at 25.4 percent and Dogecoin at 22.1 percent kept pace and only Tron, at 1.1 percent, sat the move out, measured from their 17 August lows to the new highs set at various points over the past few days.
Ether against bitcoin rose from 0.0297 to 0.0312 BTC, a five percent gain in the cross and the first sustained ratio advance since the spring. Altcoin market capitalisation aggregated via the TOTAL3 metric, which excludes BTC and ETH,) increased 21 percent to $791.5 billion, the highest reading in 203 days.
Spot Ether ETFs took in $692.6 million in the week to 21 August, their largest weekly inflow since early October and a further $295.4 million on 24 and 25 August, fuelling the Ether movel. XRP’s spot ETFs recorded their strongest week in three months with cumulative inflows of $1.55 billion since inception and the token’s move coincided with the 19 August White House meeting at which Ripple, and other major companies met with Chairs of the Securities And Exchange Commission (SEC) and the Commodity Futures Trading Commission (CFTC).
The regulatory calendar behind that meeting is dense. The SEC published its Regulation Crypto Assets proposal on 18 August, the Treasury published the GENIUS Act stablecoin rule on 17 August, and the Senate’s procedural vote on the CLARITY market-structure bill is scheduled for 15 September.
Roadmap and Our Stance
We frame the next two weeks as three scenarios, each with a condition that must be met before it is in force and a level that invalidates it.
ScenarioCondition to activateWhat it impliesWhat invalidates itAcceptance above the May shelfTwo consecutive daily closes above $82,818 (the 6 May high), with aggregate SOPR above 1 and a positive ETF print on both daysThe supply that May’s buyers hold at break-even has been absorbed; the next cost-basis reference is the Active Realised Price, which Glassnode placed near $85,200 in MayA close back below $79,000 within three sessions of the second qualifying closeConsolidation inside the shelf (base case into Friday)Price holds between the True Market Mean ($77,807) and $81,000 through the Warsh Jackson Hole keynote and the 28 August expiryThe squeeze is being converted into held positions; profit-takers at the shelf and ETF creations are roughly matched; Volatility should decay below 38 and funding stays near zeroTwo consecutive closes below $76,657 (Monday’s low), or a net-negative ETF weekSqueeze retracedTwo consecutive closes below $76,657, followed by loss of the $73,500 cost basis band for the three-six month holder bandThe advance was short covering without follow-through demand; the references become the short-term holder cost basis at $69,205 and then the old range ceiling at $67,000, where the shorts that fuelled the rally were builtA daily close back above $81,000 accompanied by a positive ETF print
Our stance moves from neutral to constructive, conditional on the shelf being held. The constructive case rests on four points: the flow-reset bar has been met in full, the marginal seller is now booking profit, the altcoin complex is participating with its own ETF financing and the options market has switched to paying for upside.
The case against acceptance at current levels rests on three issues: that the advance in price is only being driven by short liquidations, that the population holding coins between $79,000 and $82,818 sells in at least two consecutive sessions (indicating a lack of conviction) and that the futures basis remains too thin to attract arbitrage capital that would absorb that supply mechanically.
Bitcoin broke out above the three-to-six month holder cost basis near $73,500, the final cost basis resistance band. That band is now rising steeply behind price as coins bought in the summer range age into it, converting former overhead supply into support that follows the market up. If the uptrend is to continue, a successful retest of this band as support would be a symbol of overall strength in this market from an on-chain perspective.
The most recent buyers’ basis sits near $64,000. Overhead, holders from 18 months to two years ago break even near $86,500, with the six-to-12 month cohort still underwater near $94,000.
We treat consolidation between $77,100 and $81,000 through Friday as the base case, with the shelf likely to reject a first attempt. Three signals decide which scenario takes over in this order.
The ETF print through Friday comes first, because an eighth, ninth and tenth consecutive positive session keeps the floor under the base case in place, while a negative print on the day of the keynote is the earliest warning the retrace scenario can give.
The ledger at the shelf comes second, because long-term holder SOPR above 1 with price holding $77,100 means distribution is being absorbed, while that ratio falling below 0.9 on a declining price means the loss-taker has rejoined the profit-taker.
A three-day squeeze carries limited information about the trend and a two-day rejection does not end one. The buyer who financed were the ETFs and we will get more data from them before Warsh speaks. That print is what potentially gives traders a bias.
Key Levels and Signals
LevelOriginBullish signalBearish signal$82,8186 May intraday high; top of the May shelfTwo closes above, aggregate SOPR above 1.0A third intraday rejection on rising volume$78,000 to $82,00May’s 12-session close band; the 24 and 25 Aug highs sit inside itDaily close inside the band with a positive ETF printUpper wicks persist while LTH-SOPR holds above 1.1$77,807 + $77,100True Market Mean; Confluent with High Volume nodeHeld on a daily close through FridayLost on a close with volatility rising$69,205Short-term holder cost basis Spot stays more than 10 percent aboveA close below returns the market to the previous regime
The post Nineteen Of The Top-20 Altcoins Join Bitcoin’s Breakout appeared first on Bitfinex blog.