Ethereum is slowly grinding higher after December’s recovery, but it’s now pressing into a heavy multi-month resistance cluster around $3.3–$3.5K.
The price structure is constructive, and on-chain activity via active addresses is breaking higher, which is a positive backdrop. Yet, ETH is doing all of this right under resistance, so the next few days should decide whether we get a clean breakout or another rejection back into the range.
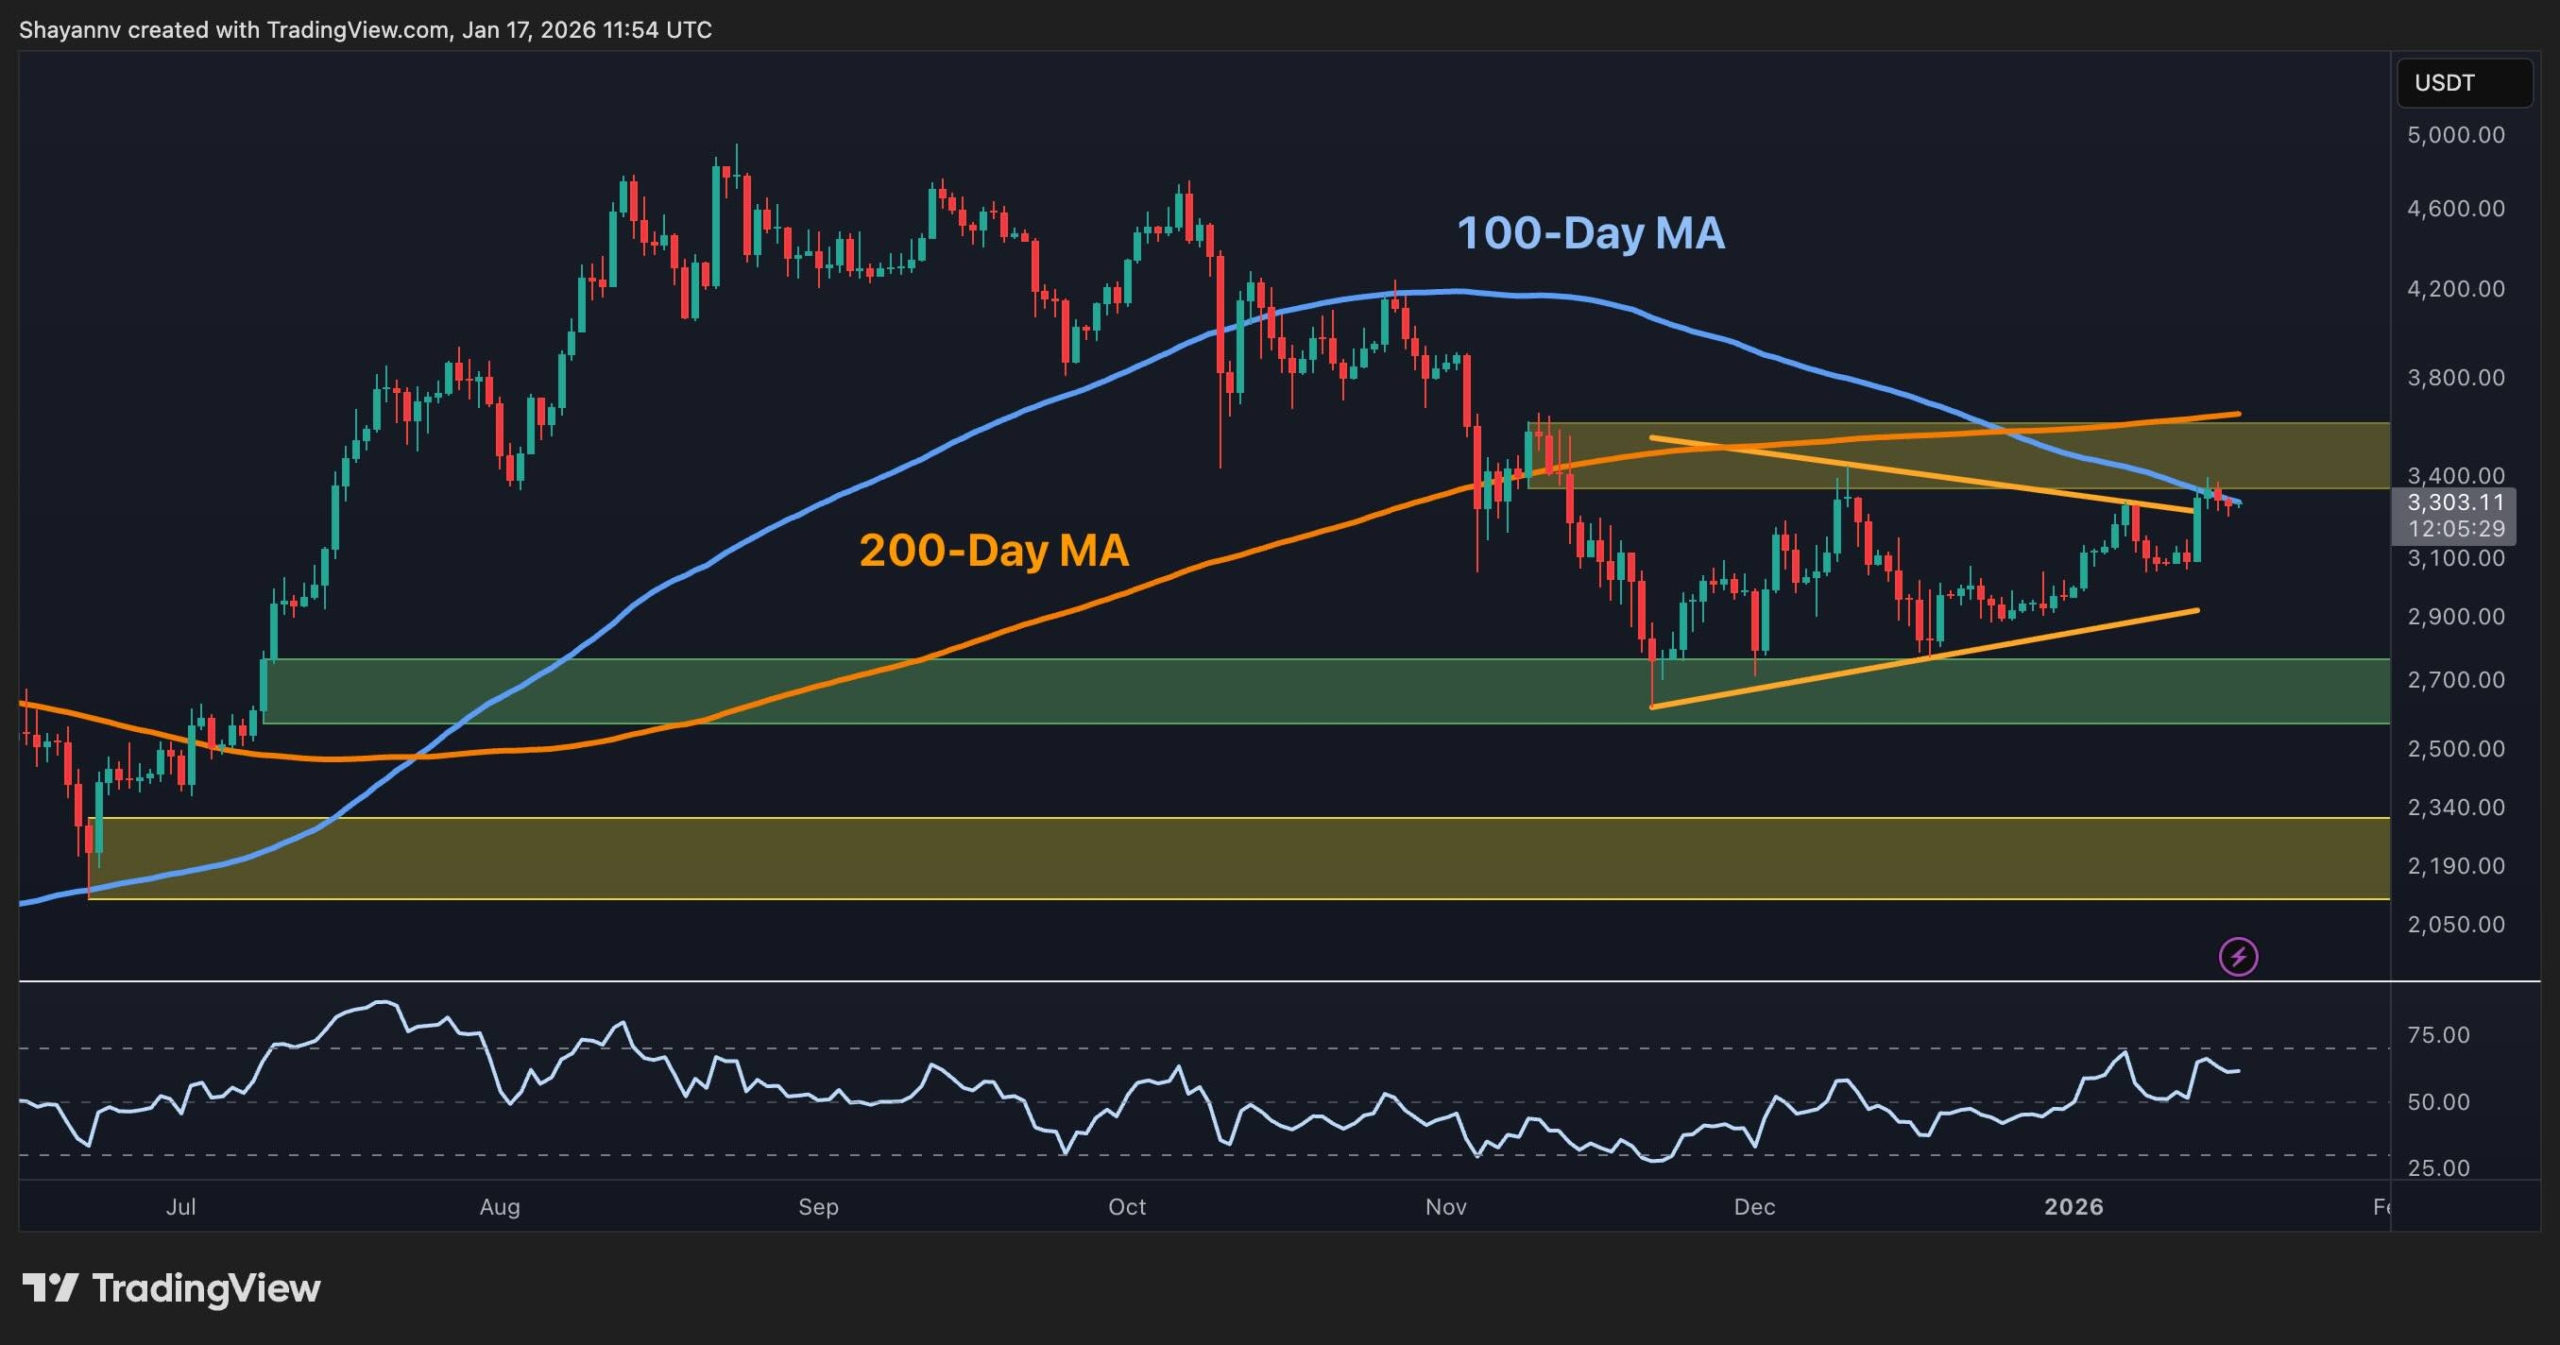
Ethereum Price Analysis: The Daily Chart
On the daily chart, ETH has bounced cleanly from the green demand zone around $2.7K mark and pushed back into the key supply area at $3.3–$3.5K. This zone lines up with the 100-day moving average, while the 200-day moving average is sitting higher as the next dynamic resistance.
As long as the price holds above the $3K area, the structure remains a series of higher lows pointing to accumulation rather than distribution. A decisive daily close above the $3.5K mark would also open the door toward the psychological $4K level, while losing the $3K zone would likely send ETH back toward the $2.7K support block.
ETH/USDT 4-Hour Chart
On the 4H, ETH has been trading within a symmetrical triangle, formed by higher lows and lower highs. However, it has recently broken the pattern to the upside, and is now testing the blue resistance band around $3.3–$3.4K. The last push into that zone came with an overbought RSI signal, which explains the current sideways/pullback behavior.
In the short-term, the local support around the $3K zone and the rising trendline just below, near the $2.9K level, should be watched. As long as those hold, buyers can still stage another breakout attempt above $3.4K. On the other hand, a clean break below the lower trendline would shift momentum back to sellers and put the $2.5K zone back on the table as downside targets.
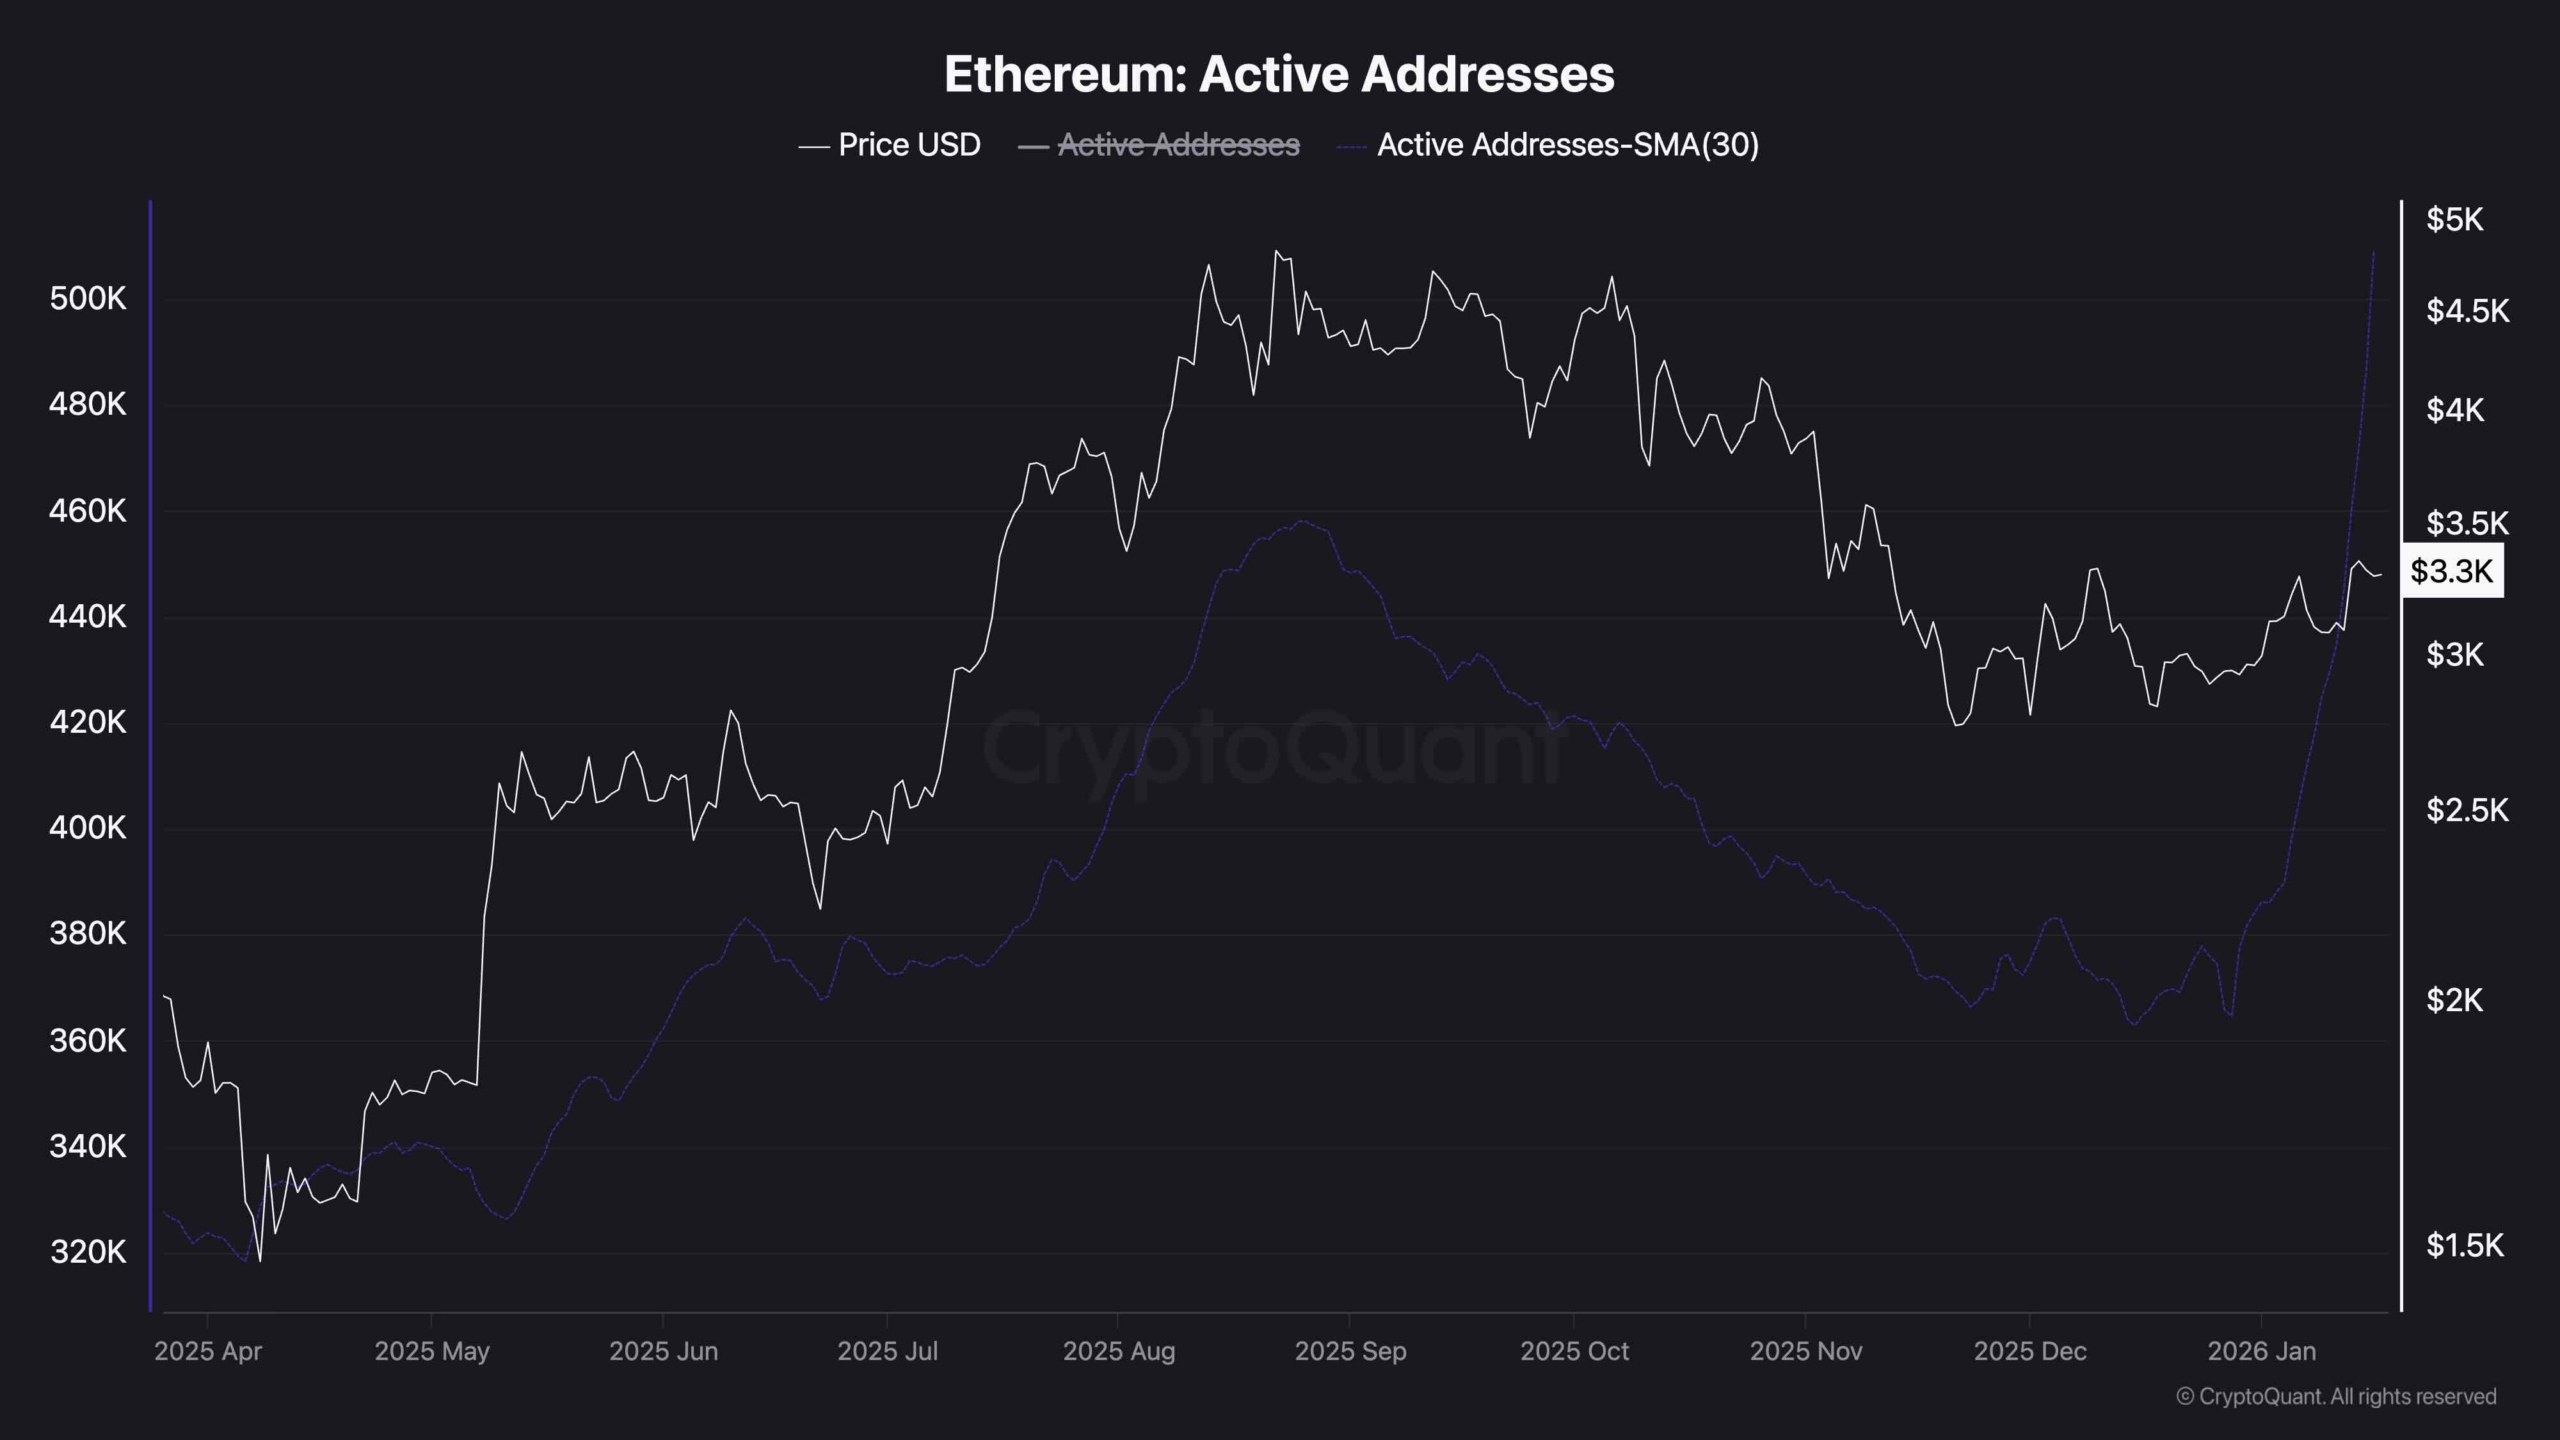
On-Chain Analysis
The 30-day moving average of Ethereum active addresses has been trending up since the beginning of this year and has now pushed above the highs of the past year, while the price is still below its prior peaks.
This massive surge in active addresses usually points to improving organic usage and network demand, which often supports uptrends after periods of consolidation. At the same time, spikes in activity right under resistance have occasionally coincided with local tops when price fails to follow through.
So if active addresses stay elevated or keep rising while ETH finally clears $3.5K, it would strongly support a new leg higher; if activity rolls over while price keeps stalling here, it would argue for a deeper cool-off back into the lower support zones.
The post Ethereum Price Analysis: ETH Nears Major Roadblock on its Way to $4K appeared first on CryptoPotato.