
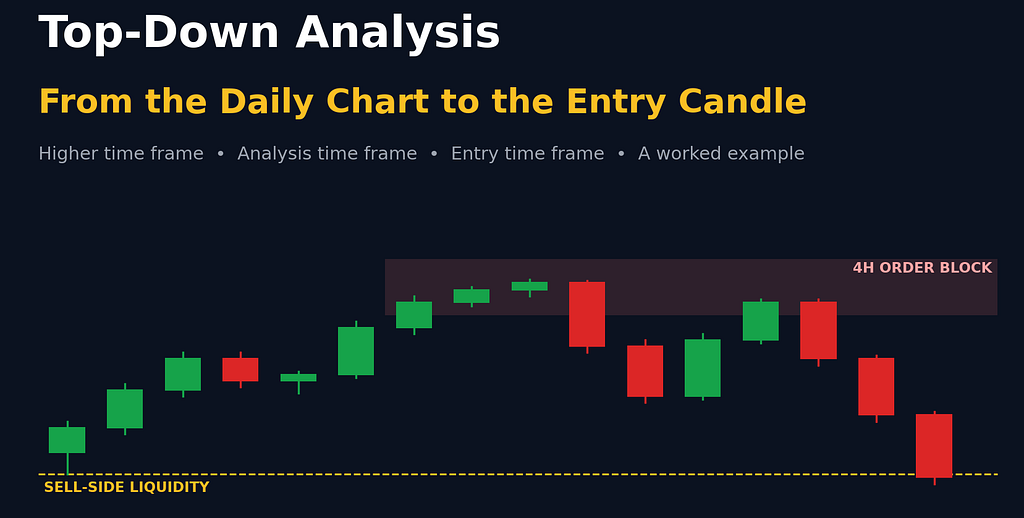
A simple three-time-frame roadmap for finding direction, building a bias and timing entries, with a worked example
One of the most common mistakes new traders make is opening a 5-minute chart, spotting a pattern and jumping in, without any idea what the bigger picture looks like. The trade might look perfect on its own, but if the daily chart is pushing hard the other way, the odds are against it from the start.
Top-down analysis fixes that. You start with the big picture and zoom in step by step, so every trade you take lines up with what the larger time frames are doing.
This article covers:
What top-down analysis is, and the three time frames every trader should useHow to read the higher time frame: trend, key levels and who is in controlHow to use the analysis time frame to map structure and mark points of interestHow to use the entry time frame to confirm and executeWhich time frames to pair, and a full worked example
All charts in this article are simplified illustrations I drew to explain the ideas. They are not real market data.
What Is Top-Down Analysis?
Top-down analysis means studying price action across several time frames, starting with the higher ones and moving down to the lower ones.
You get the big picture first, then zoom in to find a precise, higher-probability setup. Each time frame has its own job:
Higher time frame: tells you the direction, meaning who is in control, buyers or sellers.Analysis time frame: gives you structure and bias. This is where you decide whether to look for buys, sells or no trade at all.Entry time frame: gives you confirmation and execution.
Higher time frame for direction, analysis time frame for bias, entry time frame for the trigger.
Let’s go through each one.
Step 1: The Higher Time Frame (Direction)
Top-down analysis always starts at the top. Before any detailed work, look at the daily or weekly chart. These charts show the broader market, keep you aligned with the bigger picture and help keep you on the right side of price.
Find the dominant trend
First question: is price in an uptrend, a downtrend or a range? That’s the overall direction of the market.
Mark the key support and resistance levels
Next, highlight the key support and resistance levels, especially on the daily chart. These are the areas where price may react, reverse or break through.
Why does this matter so much? Because the market is fractal. The same patterns and reactions repeat on every time frame, so a small reaction on the daily or weekly chart can become a big move on the lower time frames.
That’s why, before any trade, you should check how much room price has before it reaches the next key higher time frame level. A buy setup that runs straight into daily resistance a few pips later doesn’t have much room to pay you.
Know the trend, know the levels, and know how much room price has before the next one.
Know who is in control: buyers or sellers
This part is especially important if your higher time frame is the daily or 4-hour chart. If you don’t know whether buyers or sellers are in control, there’s a high chance you’ll end up trading against the real direction.
The way to tell is to look at the most recent price origin, meaning how price is reacting to fresh, unmitigated supply and demand zones:
If the market is falling and price keeps reacting from fresh supply zones, then supply is in control. Focus on selling opportunities, not buys.Supply stays in control until price reaches a fresh demand zone and reacts strongly upward. At that point demand takes control, and you should stop looking for sells, even if a “perfect” short setup appears on a lower time frame.Control belongs to the side whose fresh zones are holding. A strong reaction from the opposite zone flips it.
Golden rule: fresh zones on a higher time frame have priority over the time frame you’re analyzing. If price taps a fresh, unmitigated higher time frame zone from the opposite side, control can shift from demand to supply, or the other way round.
Step 2: The Analysis Time Frame (Structure and Bias)
With the higher time frame done, zoom into the analysis time frame: usually the 4-hour, 1-hour, 30-minute or 15-minute chart.
This is one of the most important parts of your analysis. Read it properly and you can avoid many common traps.
Why these mid-range time frames? They don’t produce as much noise and misleading information as the lower time frames, so their data is more reliable and easier to read. At the same time, they give signals faster than the daily chart, which makes them very useful for intraday trading.
Map the structure
Identify direction from the major highs and lows. Is price making higher highs and higher lows (uptrend), lower highs and lower lows (downtrend), or moving sideways? This gives you a precise intraday bias.Mark the breaks of structure (BOS) that confirm the trend.Look for potential market structure shifts (MSS) or changes of character (CHoCH), the first signs that the trend may be turning.Label the swings, mark each BOS, and watch for the CHoCH that signals a turn.
Mark your points of interest (POIs)
Once structure is mapped, identify the points of interest, the areas where price is likely to react. A POI can be:
a fair value gap (FVG)an order blocka breaker blocka mitigation blockan inversion fair value gap (IFVG)
Example (EUR/USD, 4-hour): the most recent bearish BOS came from a strong move down that also left an inefficiency (a fair value gap). At the origin of that move sits a bearish order block, which is the last up-close candle, or series of up-close candles, before a strong bearish move that breaks structure. Here it’s two up-close candles. That’s a fresh supply zone, and exactly where you’d watch for short opportunities if price pulls back into it.
The order block sits at the origin of the move that broke structure.
By the end of this step you should have a clear view of market sentiment and what price is more likely to do next.
Step 3: The Entry Time Frame (Confirmation and Execution)
Now look for the actual entry. Zoom into the entry time frame: usually the 15-minute, 5-minute or 1-minute chart, depending on your analysis time frame.
Why go this low? Lower time frames show price action more clearly and let you enter with a better risk-to-reward ratio.
Here’s the sequence:
Wait for price to tap your analysis time frame POI and show signs of rejection.Look for a market structure shift or change of character on the entry time frame.Once the shift is confirmed, pick an entry model: a fair value gap, order block, breaker block, mitigation block or inversion FVG. Which one depends on your trading model and personal preference.Execute the order from that entry zone, with a stop beyond the swing and a target at liquidity.
Optional extra confluence on the entry time frame can make a setup stronger: VSR patterns, double sweep confirmation, or a volume profile indicator.
Which Time Frames Should You Pair?
The recommended combinations:
4-hour analysis → 15-minute entry1-hour analysis → 5-minute or 1-minute entry15-minute analysis → 1-minute entry
Rule of thumb: your analysis time frame should always be at least twice as high as your entry time frame.
Worked Example: A EUR/USD Short
Here’s how all three steps come together in one example, using the 4-hour chart for analysis and the 15-minute chart for entry.
Analysis time frame (4H): there’s an unmitigated bearish order block, a good area to look for shorts if price taps it and shows rejection on the 15-minute chart.Entry time frame (15m): you want three things: price taps the 4-hour order block, rejects from it, and creates a market structure shift.What happened: after tapping the higher time frame supply zone, price reversed and broke the last higher low, a clear MSS. Buying momentum was fading and sellers were taking control, so the 15-minute bias turned bearish.Entry model: inside the 4-hour order block there was also a 15-minute bearish order block, made of two up-close candles at the origin of the move that caused the shift.Trade plan:Entry: at the lowest point of the 15-minute order blockStop-loss: a couple of pips above the higher highTake profit: the sell-side liquidity below the swing low, about 6:1 risk-to-reward
In this scenario, the order is triggered, there’s a short drawdown, then price reverses lower and hits the take-profit. Remember this is one example chosen to explain the method; many trades won’t work out this cleanly.
4H zone → 15m shift → 15m order block entry, with the stop above the high and the target at sell-side liquidity (illustration).
Your Top-Down Checklist
Higher time frame: the trend is clear (up, down or range).Key higher time frame levels are marked, and there’s enough room to the next one.You know who is in control, based on the latest fresh zone that held.Analysis time frame: highs and lows, BOS and CHoCH are mapped.A fresh point of interest is marked.Entry time frame: price taps the POI and rejects.An MSS or CHoCH is confirmed on the entry time frame.An entry model is chosen, and the stop is placed beyond the swing.The target is at liquidity, with a healthy risk-to-reward ratio.Position size is fixed and you risk only what you can afford to lose.
Key Takeaways
Top-down analysis = big picture first, then zoom in. Each time frame has one job: direction, bias, execution.On the higher time frame, find the trend, mark the key levels and check how much room price has.Know who is in control. It’s the side whose fresh zones are holding, and higher time frame zones take priority.On the analysis time frame, map highs and lows, BOS and CHoCH, then mark fresh points of interest.On the entry time frame, wait for a tap, rejection and a structure shift before using an entry model.Keep your analysis time frame at least 2× your entry time frame (for example 4H → 15m).No method wins every time. Consistent risk management matters more than any single setup.
Disclaimer
Disclaimer: This article is for educational purposes only and is not financial advice. Trading forex, gold, crypto and other leveraged products carries a high level of risk and may not be suitable for everyone. The charts are simplified illustrations, not real market data, and the trade examples are for explanation only. Past results do not guarantee future performance. Always do your own research and never risk money you can’t afford to lose.
By reading this article, you acknowledge that you understand these risks and that you are solely responsible for your own trading decisions.
Top-Down Analysis: How to Read Any Chart From the Daily to the Entry Candle was originally published in Coinmonks on Medium, where people are continuing the conversation by highlighting and responding to this story.