
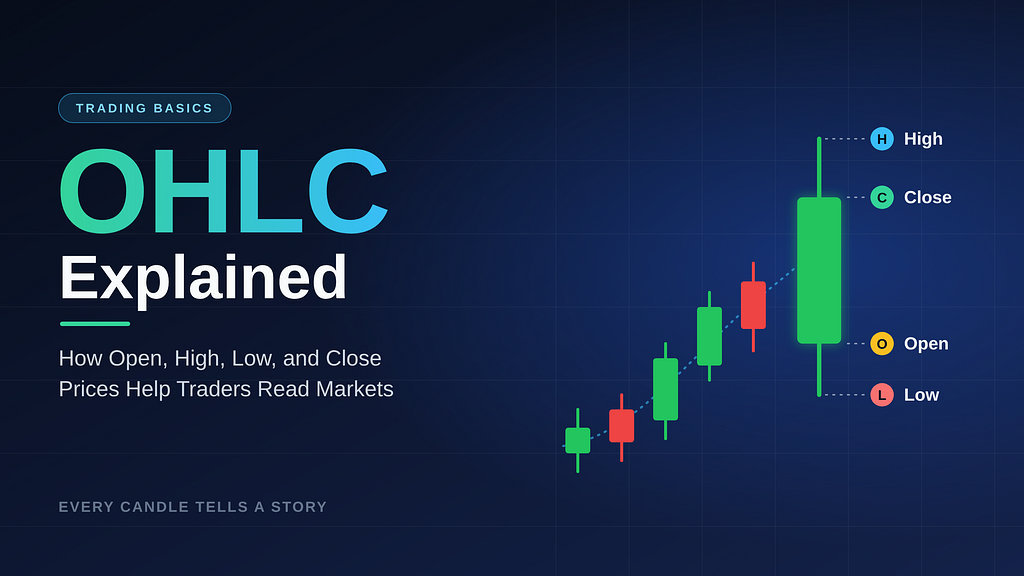
Every candlestick tells a story. Here’s how to read it, whether you trade crypto, stocks, or just want to understand the chart before you invest.
OHLC Explained — How to Read Open, High, Low, Close Prices
You open a price chart. Bitcoin is up 3%. Or Apple is down 1.5%. Or some token you bought on a friend’s tip is suddenly green.
That single number feels like information. It isn’t the whole story.
Two assets can both finish the day up 3% and have lived completely different lives. One may have climbed steadily with buyers in control all day. The other may have crashed 8% in the morning, then clawed its way back in a panic. Same ending, very different message.
The tool that separates those two stories is OHLC data: Open, High, Low, and Close. Once you understand these four prices, a candlestick chart stops looking like a pile of red and green rectangles and starts reading like a story about what buyers and sellers actually did.
This guide explains OHLC from scratch, with no jargon wall. By the end, you’ll know how candles are built, what their bodies and wicks reveal, why algorithms depend on this data, and why one candle should never be read alone.
What Is OHLC? (The Quick Answer)
OHLC stands for Open, High, Low, and Close. These are the four prices that summarize everything an asset did during a single trading period, such as one minute, one hour, one day, or one week.
Open: the first traded price of the periodHigh: the highest price reached during the periodLow: the lowest price reached during the periodClose: the last traded price of the period
Every candlestick on a chart is a visual version of these four numbers. Every OHLC bar chart is too. Whether you’re looking at Bitcoin on a one-hour chart or the S&P 500 on a daily chart, the logic is identical.
One note on timeframes: the period is up to you. A day trader might study five-minute candles. A passive investor might only care about weekly or monthly ones. The four prices work the same way at every scale.
The Four Prices, Explained With a Simple Visual
Picture a single trading day for a stock. Here’s how the four prices behave:
That’s a bullish candle: the price opened low and closed high. The thick part is the body, and the thin lines are the wicks (also called shadows or tails).
Let’s make it concrete with an example. Say a stock trades like this on Monday:
Opens at $100Climbs to a high of $108Dips to a low of $98Closes at $106
That’s the whole OHLC record: 100, 108, 98, 106. Four numbers. But look at what they tell you:
Buyers pushed the price up $8 at some point.Sellers briefly pushed it $2 below the open.By the end, buyers held most of their gains, closing $6 above the open.
A plain “up 6%” label would have hidden all of that.
Why the Close Gets So Much Attention
Traders often treat the close as the most important of the four prices. That’s because the close represents where the market settled once the period’s buying and selling was done. It’s also the price most commonly used in indicator calculations and in the daily or weekly figures you see on financial news.
The open matters too, particularly in stock markets where overnight news can create a gap between yesterday’s close and today’s open. In crypto, which trades 24/7, candles open and close based on whichever timeframe and time zone your charting platform uses, which is worth knowing when comparing charts across exchanges.
How Bullish and Bearish Candles Are Formed
The relationship between the open and the close decides the candle’s color and its direction.
Bullish Candles: Close Above Open
A bullish candle forms when the price closes higher than it opened. Buyers won the period. On most charts, bullish candles are green (or hollow, depending on the platform).
The bottom of the body is the open.The top of the body is the close.
Bearish Candles: Close Below Open
A bearish candle forms when the price closes lower than it opened. Sellers won the period. These are usually red (or filled).
The top of the body is the open.The bottom of the body is the close.
A Quick Note on Colors
Color conventions aren’t universal. Some platforms and some markets reverse them, so always check your chart settings. The color is only a shortcut. The real information is the relationship between the open and the close.
The Doji: When Open and Close Are Nearly Equal
Sometimes a period ends almost exactly where it began. The body shrinks to a thin line, and the candle is called a doji. A doji suggests indecision: buyers and sellers pushed the price around, but neither side won. Whether that matters depends heavily on what came before it, which we’ll get to shortly.
Bodies and Wicks: Reading the Range of Price Movement
The body shows where the period began and ended. The wicks show how far the price traveled in between. Together they reveal something a closing price never will: the range of the battle.
The Body: Who Controlled the Period?
A long body means strong, one-sided movement. Either buyers or sellers dominated.A short body means a smaller net move. The market was balanced, quiet, or undecided.
The Wicks: Where Price Was Rejected
A wick shows prices that were reached but not accepted.
An upper wick means price rose to a high, then sellers pushed it back down before the close.A lower wick means price fell to a low, then buyers pushed it back up before the close.
Think of wicks as footprints of rejected prices.
Reading the Story: Three Quick Examples
1. Long lower wick, small body near the top: Price dropped sharply, then buyers stepped in and drove it back up. This is the shape of the classic hammer. It suggests that sellers lost control at the lows.
2. Long upper wick, small body near the bottom: Price spiked, then sellers shoved it back down. This is the shape of a shooting star. It suggests buyers ran out of strength at the highs.
3. Long body, tiny wicks: Price barely wandered from its open or close. Whoever was in control stayed in control all period. Traders sometimes call this a marubozu.
These names are useful vocabulary, but don’t memorize them as magic signals. Memorize what they mean in plain language: who pushed, who pushed back, and who won.
Why OHLC Data Powers Charting, Indicators, and Algorithmic Trading
OHLC isn’t just a pretty way to draw charts. It’s the standard data format behind most market analysis.
Charting
Candlestick charts and OHLC bar charts both plot the same four values per period. Candlesticks, which originated in Japanese rice markets, became popular because the body-and-wick shape makes the open-versus-close relationship visible at a glance. Today they’re the default on nearly every major charting platform for both stocks and crypto.
Technical Indicators
Many of the indicators beginners hear about are calculated directly from OHLC data:
Moving averages typically smooth out closing prices over a set number of periods.RSI (Relative Strength Index) measures the speed and size of recent price changes, usually based on closes.Bollinger Bands use a moving average of closes plus a measure of volatility.ATR (Average True Range) uses the high, low, and previous close to estimate how much an asset typically moves.
If you don’t understand the inputs, the indicators become black boxes. Understanding OHLC means understanding what these tools are actually measuring.
Algorithmic Trading
Automated strategies need structured, consistent data, and OHLC is exactly that. A rule-based strategy might say something like: “If the close is above the 50-period moving average and the latest candle closed higher than it opened, consider a long position.” Every part of that rule is built from open and close values.
Backtesting works the same way. Developers feed historical OHLC data into a strategy to see how its rules would have behaved in the past. That’s also why data quality matters: missing candles, wrong timestamps, or inconsistent time zones can produce misleading results.
A caution worth stating clearly: backtested results are not predictions, and no indicator or algorithm removes risk. OHLC helps you describe what happened. It doesn’t promise what happens next.
Why One Candle Should Never Be Read Alone
This is where most beginners go wrong.
They learn that a hammer is “bullish” and a shooting star is “bearish,” then trade every one they spot. Single candles are easy to find and easy to over-trust.
Here’s why context matters.
Context Question 1: What Came Before?
A hammer after a long, steady decline can suggest sellers are tiring. The exact same hammer shape in the middle of a sideways range may mean almost nothing. The candle didn’t change. Its surroundings did.
Context Question 2: Where Is It on the Chart?
A candle that forms near a price level where the market has previously reversed carries more weight than one floating in empty space. Support and resistance levels give individual candles a setting.
Context Question 3: What Does Volume Say?
A big move on strong trading volume tells a different story than the same move on thin volume. High volume suggests broader participation. Low volume suggests the move may be easier to reverse.
Context Question 4: What’s the Bigger Timeframe Doing?
A bearish candle on a five-minute chart might be a tiny pullback inside a powerful daily uptrend. Zoom out before you decide what a candle means.
Context Question 5: What’s Happening Outside the Chart?
Earnings reports, interest rate decisions, regulatory news, and exchange-specific events can all distort a candle. A huge wick caused by a one-off liquidity event is not the same as a wick formed by steady supply and demand.
The Key Insight
Treat each candle as a clue, not a verdict. The best traders read candles in groups, alongside trend, levels, volume, and risk management. A single candle is one sentence. The chart is the paragraph.
Putting It Into Practice: A 5-Step Habit for Reading Any Candle
Next time you look at a chart, run this quick checklist:
Find the open and close. Is the candle bullish or bearish?Check the body size. Was the move decisive or tentative?Look at the wicks. Where did price get rejected?Zoom out. What’s the trend and what are the nearby key levels?Ask what’s missing. Volume? News? A bigger timeframe?
Do this for a few weeks and you’ll notice something: charts start to feel less random. You still can’t predict the future, but you can describe the present with far more precision.
From Reading Charts to Managing Exposure
Understanding OHLC is the foundation. The next challenge is applying it consistently, because markets run around the clock, crypto never closes, and nobody can watch every chart at every hour.
That’s where automation enters the picture for many investors. Tools built on rules and data can monitor markets continuously and help diversify across assets rather than leaving a portfolio concentrated in one or two coins or stocks.
If you’re exploring that route, one option worth subscribing to is Hyperlyx AI, an investment assistant designed to help traders and investors automate trading across crypto and stocks, diversify their portfolios, and manage exposure to their assets.
A note that matters right now: AI agents connecting to bank accounts and wallets has become a real security concern. Hyperlyx AI takes a different approach. It operates independently, without requiring you to connect your wallets or bank accounts. For anyone cautious about handing access to an automated system, that distinction is worth understanding before you choose any tool.
Learn more about Hyperlyx AI on its website.
Frequently Asked Questions About OHLC
What does OHLC stand for in trading?
OHLC stands for Open, High, Low, and Close, the four prices that summarize an asset’s movement during a given time period.
What is the difference between OHLC and candlestick charts?
OHLC is the data. A candlestick chart is one way to display it. OHLC bar charts are another, using small vertical bars with side ticks for open and close.
What does a green or red candle mean?
Typically, green means the price closed above its open (bullish), and red means it closed below its open (bearish). Colors can vary by platform, so check your settings.
What do candlestick wicks show?
Wicks show the highest and lowest prices reached during the period. Long wicks indicate that price moved far from where it eventually settled, often signaling rejection of those levels.
Can I trade using a single candlestick?
It’s risky. A single candle is easily misleading without trend, support and resistance, volume, and timeframe context.
Why is OHLC data important for algorithmic trading?
Algorithms need structured, consistent inputs. OHLC data supplies those inputs for signals, indicators, and backtesting.
Does OHLC work for both crypto and stocks?
Yes. The four prices are defined the same way in every market, though crypto trades 24/7, so period boundaries depend on the platform’s time settings.
The Bottom Line
Price alone tells you where the market is. OHLC tells you how it got there.
The open shows where the story began. The high and low show how far buyers and sellers pushed. The close shows who won the round. Bodies and wicks turn all of that into a shape your eyes can read in a second.
Learn these four prices, always read them in context, and every chart you open becomes a little less intimidating and a lot more informative.
If this helped you see charts differently, please give it a clap, follow for more beginner-friendly trading education, and repost it. Someone in your network is staring at a green and red chart right now wondering what it all means. A quick share could be the thing that makes it click for them.
OHLC Explained: How Open, High, Low, and Close Prices Help Traders Read Markets was originally published in Coinmonks on Medium, where people are continuing the conversation by highlighting and responding to this story.