
The fear itself added nothing beyond the price drop. A short version of our data study.
The Crypto Fear & Greed Index fell from 50 to 28 in a single day, after Bitcoin dropped almost 6%. That is close to its own Extreme Fear zone, and the “be greedy when others are fearful” posts are already out. We wanted to know whether that rule has actually worked, so we tested it.
What we tested
We took the Fear & Greed Index from alternative.me, daily from February 2018 to October 2026, and Bitcoin’s daily closing price. We used the index’s own label: Extreme Fear is a value of 25 or below. An episode starts on the first day in the zone after at least 14 days outside it. That gives 27 Extreme Fear episodes.
For each one, we bought at that day’s close and measured the return 7, 30, 90 and 180 days later. Then we compared it with three things:
All days in the period.Random days, drawn 10,000 times.The same drop without the fear: days that had a similar 30-day price change but were not in Extreme Fear.
The third comparison is the one that matters. Extreme Fear usually arrives after the price has already fallen. So the real question is not “did Bitcoin go up after fear?” but “did the fear tell you anything the price chart didn’t?”
What the data shows
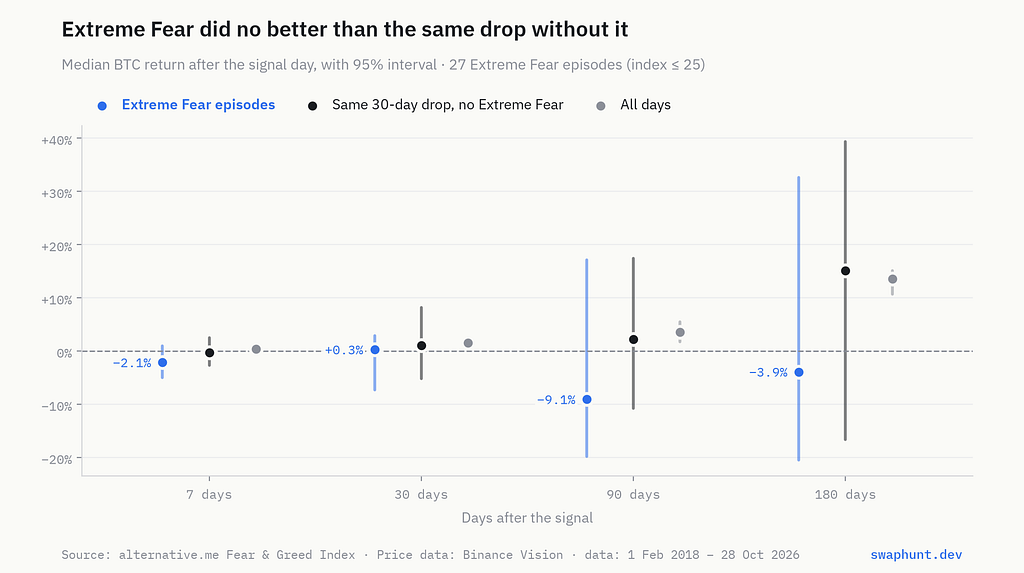
Median Bitcoin return after Extreme Fear, after the same drop without Extreme Fear, and on all days
Median returns. At no horizon did buying after Extreme Fear beat buying on an average day. And at every horizon, the same drop without the fear did at least as well.
Three things worth knowing before you draw conclusions:
The uncertainty is large. With 27 episodes, every 95% interval crosses zero. This is not proof that Extreme Fear is a bad signal. It is the absence of evidence that it is a good one.
2018 drives the long horizon. Five of the six 2018 episodes were followed by losses over 180 days. Remove 2018 and the 180-day median becomes +22.1%. But Extreme Fear and the same drop without it then end up roughly level. Either way, the fear added nothing you could rely on.
The range is enormous. After 180 days, the worst episode was down 51.5%, while one in ten was up more than 66.1%. Which one you got depended mostly on the year.
Why it doesn’t work
Half of the index comes from Bitcoin’s own recent price behaviour: volatility (25%) and momentum and volume (25%), compared with the last 30 and 90 days. By the time the index hits Extreme Fear, the drop has usually already happened. The index is a mood ring for the last few weeks of price, not a forecast.
Extreme Fear also comes in clusters. Six episodes in 2018, five in 2019, five in 2022. In those bear markets, the first Extreme Fear was not the bottom. It was the start of a long series of them.
What this means
Don’t treat Extreme Fear as a buy button. In our data, it did not beat the same drop without the fear.If you buy dips, the dip is the information. The index adds nothing you can’t see on the price chart.Plan for more than one. If you buy the first Extreme Fear, have a plan for the fifth.
Nothing here is a trading rule or investment advice. Fees and slippage are not included; this measures what the price did, not a strategy.
The full study
The full article has every episode, the robustness checks (stricter thresholds, different episode gaps, leave-one-year-out) and the Extreme Greed results: Extreme Fear has not been a reliable buy signal for Bitcoin.
The scripts and derived data are open: swaphunt/research on GitHub.
Data: Crypto Fear & Greed Index (alternative.me). Bitcoin price data: Binance Vision (CC BY-NC-SA 4.0). Charts are CC BY-NC-SA 4.0. Originally published on swaphunt.dev.
Feelings are free. So is the price chart.
Is Extreme Fear a buy signal for Bitcoin? We tested every episode since 2018 was originally published in Coinmonks on Medium, where people are continuing the conversation by highlighting and responding to this story.