
Why one quarterly report can reshape your exposure, your position sizes, and your downside, even if you never place a trade.
How Earnings Reports Change Your Portfolio Risk Profile
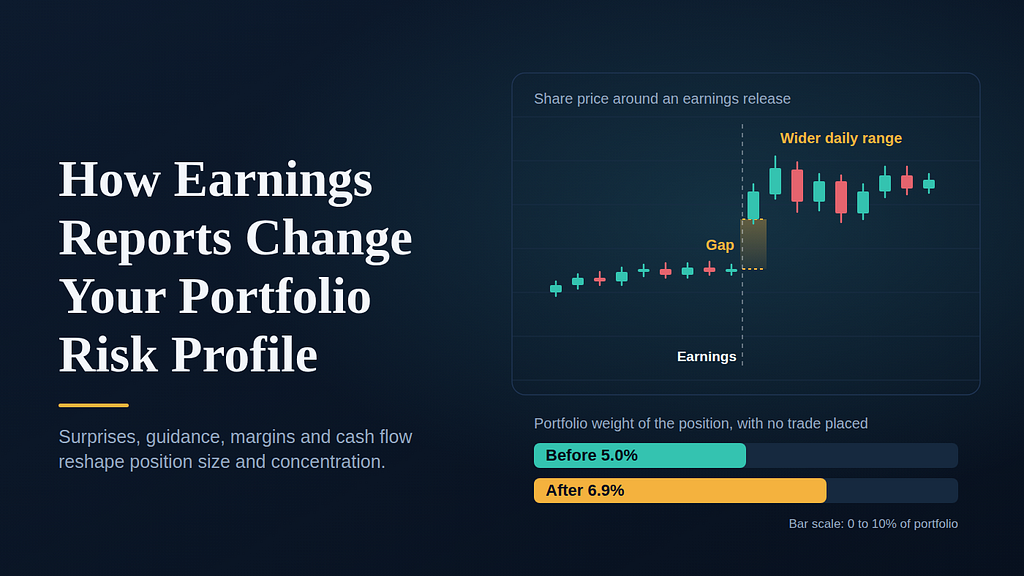
You own a stock that makes up 5% of your portfolio. It reports earnings after the bell, jumps 40% overnight, and by the next morning it is nearly 7% of your portfolio. You didn’t buy anything. You didn’t change your plan. Yet your risk profile just changed.
That is the part of earnings season most investors miss. We treat an earnings report as a verdict on one company: beat or miss, up or down. But an earnings report is also a portfolio event. It changes how big your position is, how volatile it will be going forward, how correlated it is with everything else you own, and how much damage the next surprise can do.
This guide explains how earnings reports change portfolio risk, which parts of a report matter most, and how to use position sizing and concentration limits to stay in control.
The Short Answer: How Do Earnings Reports Affect Portfolio Risk?
Earnings reports affect portfolio risk in four main ways:
Price gaps change the weight of a position instantly, which can push you into unintended concentration.Guidance and margin changes alter a company’s future volatility and sensitivity to the economy.Cash flow quality reveals whether reported profits are durable, which affects the odds of a future shock.Post-earnings volatility changes how much a position can move day to day, which changes its contribution to total portfolio risk.
In other words, earnings don’t just update your view of a stock. They update the risk budget that stock consumes inside your portfolio.
Why Earnings Are a Portfolio Event, Not Just a Stock Event
Portfolio risk is the likelihood and magnitude of losses across all your holdings combined, shaped by position sizes, volatility, and how closely holdings move together.
Most stock pickers analyze earnings one company at a time. That works for forming an opinion, but it ignores three things that drive real portfolio outcomes:
Weight drift: Winners get bigger and losers get smaller, so your allocation changes without any action on your part.Volatility regime shifts: A company that reports a surprise often trades differently afterward, with wider ranges and sharper reactions to news.Correlation clustering: During earnings season, stocks in the same sector or theme tend to react to the same signals, so several of your holdings can move together.
A portfolio of ten stocks can feel diversified until three of them report in the same week and are all tied to the same demand trend. Then it behaves like a much smaller portfolio.
Earnings Surprises: When a Beat Becomes a Risk Event
An earnings surprise is the difference between a company’s reported results and what analysts expected, usually measured on earnings per share (EPS) and revenue.
It is tempting to see surprises as good or bad. For risk purposes, the size of the move matters more than the direction.
Gap risk is the core issue
After the close, you cannot sell. A stock can open far above or below its prior close, skipping every price in between. This is gap risk, and it means stop-loss orders offer little protection through earnings. If you set a stop at 8% below your entry and the stock opens 25% lower, you are filled near the open, not at your stop.
Upside surprises change your risk too
A big beat feels like a win, and it is. But it also:
Raises the position’s weight in your portfolio.Raises the bar for the next quarter, so future reports carry more downside if expectations are now stretched.Often attracts new momentum buyers, which can increase volatility.
A position that has doubled can become a concentration problem even though it is your best performer. Winning positions deserve the same risk review as losing ones.
A simple example
Imagine a $100,000 portfolio with a 5% position ($5,000) in one stock.
If it falls 20% on earnings, you lose $1,000, or 1% of the portfolio.If that same stock were a 15% position ($15,000), the same 20% drop costs $3,000, or 3% of the portfolio.
The stock’s reaction is identical. The portfolio impact triples. This is why position sizing, not stock selection alone, determines how an earnings miss feels.
Guidance: The Number That Often Matters More Than the Quarter
Guidance is management’s forecast for future revenue, earnings, or margins. Markets are forward-looking, so guidance frequently moves the stock more than the quarter just reported.
A company can beat on EPS and still drop sharply because it lowered its outlook. From a risk perspective, guidance matters for three reasons:
It resets expectations: Lower guidance can trigger a re-rating of the valuation multiple, not just the estimates.It signals visibility: Withdrawn or widened guidance suggests management is less certain, which usually means more volatility ahead.It affects sector peers: A supplier cutting its outlook can pressure customers, competitors, and related holdings in your portfolio.
When guidance changes, don’t only ask whether the stock is cheap or expensive. Ask: Has the range of possible outcomes for this company widened? If yes, your position may deserve a smaller size even if your bullish thesis is intact.
Margins: How Earnings Reveal Operating Leverage
Margins show how much of each revenue dollar becomes profit. They also reveal how sensitive a business is to changes in demand and costs.
Gross margin reflects pricing power and input costs.Operating margin reflects how well the company controls overhead.Net margin captures the final result after interest and taxes.
The risk lesson is operating leverage. Companies with high fixed costs see profits swing dramatically when revenue changes. Expanding margins can signal efficiency, but they can also mean a business is running hot and has less room for error.
Watch for these patterns:
Margin expansion on slowing revenue: Often driven by cost cuts, which have limits.Margin compression with rising revenue: The business may be buying growth, which can strain profitability.Margins diverging from peers: This may signal a competitive shift that will show up in related holdings.
If margins show that a company is more sensitive to the economy than you assumed, that company is effectively a bigger bet on the macro environment. Your portfolio’s hidden exposure just went up.
Cash Flow: The Quality Check on Reported Earnings
Earnings can be shaped by accounting choices. Cash is harder to fake. That’s why experienced investors compare net income to operating cash flow and free cash flow (operating cash flow minus capital expenditures).
Pay attention to:
Earnings growing while cash flow stalls: This can indicate aggressive revenue recognition, rising receivables, or ballooning inventory.Free cash flow turning negative: The company may need to borrow or issue shares, which adds financial risk.Heavy capital spending: Large investment can be a growth signal, but it also raises the cost of being wrong.Debt and interest coverage: Weak cash generation combined with leverage makes a stock fragile in downturns.
Cash flow is the best early warning that a high-quality earnings beat may not be durable. A stock with deteriorating cash flow can look safe until the quarter it isn’t, which is exactly when a large position hurts.
Post-Earnings Volatility: What Happens After the Gap
The first move is only part of the story. After earnings, volatility often behaves in recognizable ways:
Volatility crush: Implied volatility in options typically falls once the uncertainty of the report is resolved.Post-earnings drift: Stocks that surprise significantly sometimes continue moving in the same direction for days or weeks.Regime change: A major surprise can permanently change how a stock trades, making it more sensitive to news.
Use the implied move as a risk gauge
Options markets price an expected earnings move (the implied move) before the report. If the market implies a 10% move and your position is 8% of your portfolio, you are exposed to roughly 0.8% of portfolio value on an average outcome, and meaningfully more on a tail outcome.
This gives you a practical rule: size positions so that a move two or three times larger than the implied move is still tolerable. Surprises that exceed expectations are exactly what makes earnings season risky.
Position Sizing: The Lever That Matters Most
Position sizing is deciding how much capital to allocate to each holding. It is the most direct tool for controlling earnings risk, because it determines how much a surprise can hurt.
Here are practical approaches:
Fixed maximum weight: Cap any single stock at a set percentage, such as 5% to 10%, depending on your risk tolerance.Pre-earnings trimming: Reduce exposure to a position you like but that has a large expected move.Risk-based sizing: Allocate less to more volatile stocks so each contributes a similar amount of risk.Staged entries: Build positions gradually and add after earnings, once uncertainty has been resolved.
None of these require predicting whether a company will beat or miss. They protect you from being wrong, which is the entire point of risk management.
Concentration and Correlation: The Hidden Multiplier
Concentration risk is the danger of having too much exposure to a single stock, sector, or theme. Earnings season magnifies it in two ways.
Same-theme clustering
Owning five different semiconductor, cloud software, or consumer discretionary stocks may look like diversification. But if they respond to the same demand signals, a single negative report from one can drag down the rest. Earnings from a bellwether company often move its entire industry.
Weight drift after a winning streak
If a few holdings outperform for several quarters, they quietly dominate your portfolio. A 25% concentration in one name that has run up is far riskier than the 10% you originally intended.
Calendar clustering
Many companies report within the same two-to-three-week window. If your biggest positions all report in one week, you carry a lot of binary risk at once. Mapping your holdings against the earnings calendar helps you avoid stacking events.
A Practical Earnings Risk Checklist
Before a report, ask:
What percentage of my portfolio is this position today?What is the implied move, and what happens to my portfolio if the stock moves twice that?Which other holdings are tied to the same theme or customer base?Do I understand what guidance, margins, and cash flow need to show for my thesis to hold?
After a report, ask:
Did the position’s weight drift beyond my limit?Did guidance or margins change the range of future outcomes?Did cash flow confirm or contradict the earnings story?Has volatility changed enough that my sizing no longer fits?
Reviewing your portfolio after each earnings cycle turns reactive investing into a repeatable process.
Where Automation Fits In
The hard part isn’t understanding these ideas. It’s applying them consistently across many positions while earnings reports, price gaps, and rebalancing needs pile up. Tracking weights, exposure, and volatility manually across stocks and crypto can quickly become a full-time job.
That’s one reason some investors are exploring AI-driven tools. Hyperlyx AI is an investment assistant built to trade crypto and stocks through automation, helping investors diversify and keep an eye on exposure across assets. The difference worth noting: with concerns growing about AI agents that need access to sensitive accounts, Hyperlyx AI operates independently, without requiring you to connect your wallets or bank accounts.
No tool replaces your own judgment or a sound sizing framework. But if you want help managing portfolio exposure systematically, then subscribe to Hyperlyx AI now.
Frequently Asked Questions
Do earnings reports increase portfolio risk?
They can. Earnings reports create price gaps, shift position weights, and change a stock’s future volatility. Even without trading, a single report can change your concentration and overall risk.
Should I sell before earnings?
Not necessarily. Many investors hold through earnings. The better question is whether your position size is small enough that a large adverse move is tolerable. Trimming is one option, not a requirement.
What is the most important number in an earnings report for risk?
There isn’t one, but guidance often moves prices most, while free cash flow best indicates earnings quality. Together with margins, they show how stable future results may be.
How big should a position be going into earnings?
There is no universal answer. A common approach is capping single stocks at a modest percentage of the portfolio and sizing smaller when the implied move is large. Your risk tolerance and time horizon should guide the number.
What is post-earnings announcement drift?
It is the tendency for stocks with large earnings surprises to keep moving in the same direction for a period after the report, rather than fully adjusting on day one.
How can I avoid concentration risk during earnings season?
Track position weights regularly, group holdings by theme or sector, check the earnings calendar for clustered reports, and rebalance when any position drifts past your limit.
Final Thoughts
Earnings reports are more than a score for one company. They are a stress test for your whole portfolio. A beat can quietly create a concentration problem. A miss can reveal that a position was too large for its volatility. Guidance, margins, and cash flow tell you how wide the range of future outcomes has become, and position sizing decides how much of that range you can afford to absorb.
The investors who navigate earnings season best aren’t the ones who predict every surprise. They’re the ones who build portfolios that can survive being wrong.
If this was useful, clap, follow, and share it with a fellow investor who tracks earnings season.
How Earnings Reports Can Change Your Portfolio’s Risk Profile was originally published in Coinmonks on Medium, where people are continuing the conversation by highlighting and responding to this story.