
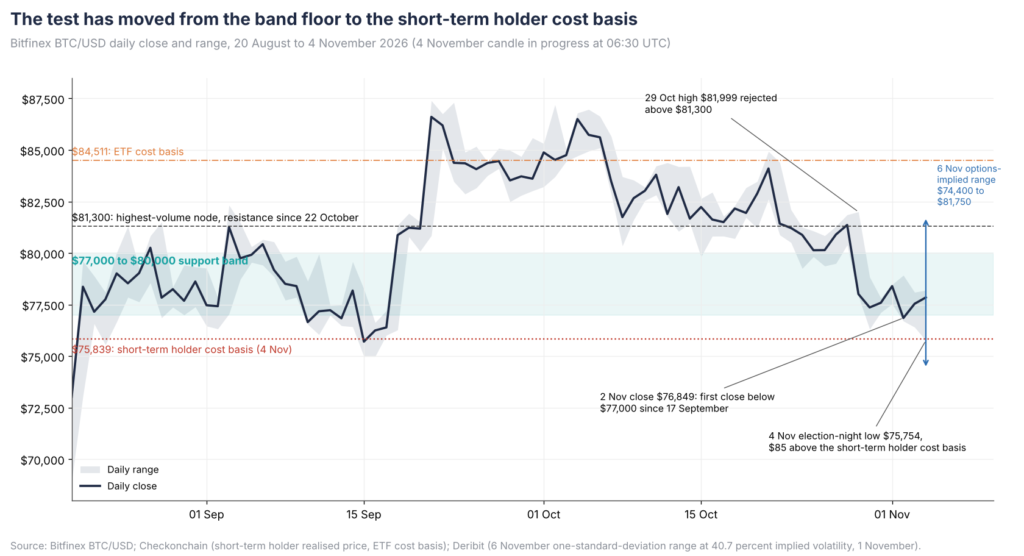
In the wake of the US mid-term elections, bitcoin saw a short drop to the short-term holder cost basis (STH-CB), currently at $75,839, before recovering back into the current key support level of $77,000 to $80,000.
Figure 1: Bitfinex BTC/USD daily close and range, 20 August to 4 November, with the $77,000 to $80,000 band.
The first question after any test of support is: who is buying. Historically, a bitcoin floor supported mainly by perpetual futures buying has not held for long.
Aggregate bitcoin futures open interest (OI) in BTC-notional terms rose to 701,548 BTC on 3 November, its highest since 22 September. Perpetual funding rates have held close to 11 percent annualised over the past two weeks despite the price correction, while spot buyers have shown little aggression. Together, these readings suggest the bid under $77,000 is primarily underpinned by perpetual futures positions, rather than spot demand.
Indeed, both short and long-term holders have continued to distribute spot holdings, though at a slower pace than during the early October highs above $80,000. The short-term holder Spent Output Profit ratio, which measures whether coins held for less than 155 days are distributed at a loss or a profit, has been below 1 for six consecutive trading sessions, reaching 0.994 on 4 November. This indicates distribution at a loss and is the longest run since the eight days ending 17 August. Net realised loss across all holders also deepened to 24,600 BTC on 4 November from 13,000 BTC on 2 November, the largest since 7 August.
Figure 2: Net realised profit and loss in BTC (all holders) and short-term holder SOPR, 1 July to 4 November
Holders who bought between $77,000 and $84,000 in October have sold into each approach of their cost basis rather than defending it. Every recovery since 30 October has been driven by short covering rather than new investor demand.
The realised price distribution (UTXO Realised Price Distribution – URPD), which shows where bitcoin last moved, reflects the shift. Supply acquired between $77,000 and $80,000 rose to 1.28 million BTC on 4 November from 1.05 million on 1 November, while supply acquired between $81,000 and $84,000 fell by 92,000 BTC to 1.12 million BTC over the same period.
Figure 3: URPD, 1 November vs 4 November
Coins are moving from October buyers above the band to new holders inside it, thickening the cost basis within the band without adding net demand. Below the band, only about 353,000 BTC was acquired between $75,000 and $77,000. A sustained move below the short-term holder cost basis (STH-CB) would find little support before the $70,000 to $75,000 range.
ETF Flows: $1.16 Billion Sold in Three Sessions
With corporate treasury accumulation slower than earlier in the year, weakening ETF demand removes another important source of buying.
US spot bitcoin ETFs have recorded $1.16 billion between 30 October and 2 November, the largest for the complex since the end of June, pushing net flows for 2026 marginally negative, at $60 million. BlackRock’s IBIT accounted for $405.3 million of outflows on 2 November alone, its largest daily outflow since 26 June, although the fund itself remains about $3.7 billion net positive for the year.
Figure 4: US spot bitcoin ETF net daily flows, 1 September to 3 November
What matters now is how the current streak resolves after the election. A single positive print for 4 November would therefore prove little. Three consecutive inflow days of a size comparable to the outflows we have just seen would be the first evidence that institutional demand has returned.
Figure 5: Bitcoin returns 10 sessions after each 2026 outflow run, grouped by how the run ended (Source: Farside Investors)
Options: The Election Premium Is Gone, Friday Is Call-Heavy and the CPI Week Is Hedged
DVOL, which measures the 30-day volatility implied by bitcoin option prices, stood at 38.7 at 06:00 UTC on 4 November, below its 40 close on 31 October. Implied volatility (IV) fell through the US mid-term elections, meaning the premium paid for protection around the result was given back without the move priced in.
Protection against a fall still costs more than protection against a rise. The $72,000 put expiring on 6 November is priced at 60.2 percent IV, against 48.1 percent for the $85,000 call, a gap which has widened from 7.6 points just on 1 November.
Figure 6: Deribit open interest by strike for the 6, 13 and 27 November expiries (Source: Deribit)
The 6 November expiry holds 30,310 BTC of OI with a put/call ratio of 0.36, or nearly three calls for every put. Calls are concentrated at $82,000 (6,146 BTC) and $85,000 (5,152 BTC), with puts concentrated at $74,000 and $75,000. Max pain (the strike at which expiring options are worth the least) sits at $79,000. At an at-the-money IV of 40.7 percent, the one-standard-deviation range into Friday’s expiry is about $75,500 to $80,200, placing both the STH-CB and the top of the band inside the expected move.
The 13 November expiry has the opposite shape, with 14,783 BTC of OI, a put/call ratio of 2.1 and 4,098 BTC of $74,000 puts. It covers the 10 November Consumer Price Index (CPI) release, suggesting traders are hedging the inflation reading rather than the election.
Altcoins: Deeper Drawdowns, Only Slightly Stronger Bounces
Altcoins have again fallen further than bitcoin and recovered only slightly faster on aggregate. Across 15 of the largest altcoin pairs on Bitfinex, the median drawdown from the 28 October close to the low through 4 November is 12.3 percent, 1.8 times bitcoin’s 6.9 percent. The median bounce from the election-night low is 3.4 percent, against 2.8 percent for bitcoin. The highest-beta names have led the bounce, a pattern consistent with short covering rather than of investors rotating into the sector.
The test we set in this week’s Bitfinex Alpha for altcoin leadership was for ETH/BTC to hold above 0.0298. Until ETH/BTC reclaims this level and ether ETFs reverse seven consecutive outflow days totalling $656 million, we would continue to read altcoin strength as short covering. A bitcoin close below $75,839 would likely produce altcoin losses of roughly twice bitcoin’s.
Figure 7: 15 Bitfinex altcoin pairs and BTC/USD, drawdown, election-night move and bounce
Macro: The Election Passed Without a Shock. History Says the Equity Tailwind Comes Later
Following the results of the US midterm elections, tech futures initially dropped, with Nasdaq 100 futures falling 2.3 percent to 27,793, while 10-year Treasury yields dipped 6 bps to 4.9 percent, and the dollar index slipped 0.3 percent to 101.4. Bitcoin followed, bottoming an hour later inside the support band.
The early recovery was driven by leverage dynamics rather than spot demand:
A two-sided liquidation cleared $62 million of bitcoin longs near the low and $51 million of shorts above $77,000. With crypto-native OI flat, short-covering pushed prices higher.
Funding rates briefly fell from 11 percent to 4.1 percent annualised, reducing long-biased taker positioning.
DVOL fell from 39.7 to 38.3, leading dealers to unwind election hedges and add buying support.
Sustaining this bounce requires actual spot demand. By Friday, that means Nasdaq 100 futures holding above 27,793, ETF flows turning positive on 4 and 5 November and funding remaining under 5 percent above $77,000, with Friday’s payrolls report serving as the key catalyst.
Horizon after election dayS&P 500 median (positive outcomes, 19 midterms since 1950)Nasdaq Composite median (positive outcomes, 13 midterms since 1974)Bitcoin 2014Bitcoin 2018Bitcoin 2022One day+0.6 percent (15 of 19)+0.2 percent (9 of 13)+2.7 percent+0.8 percent-14.2 percentOne week+1.4 percent (14 of 19)+0.8 percent (8 of 13)+11.5 percent-1.0 percent-9.0 percentOne month+2.3 percent (15 of 19)+2.2 percent (10 of 13)+12.5 percent-45.9 percent-7.1 percentThree months+7.7 percent (17 of 19)+8.6 percent (12 of 13)-30.8 percent-46.1 percent+25.3 percentSix months+15.9 percent (19 of 19)+14.7 percent (13 of 13)-28.5 percent-6.5 percent+49.1 percentTwelve months+14.5 percent (19 of 19)+18.9 percent (12 of 13)+24.1 percent+43.4 percent+92.0 percent
Figure 8: Performance after US midterm elections, S&P 500 and Nasdaq Composite medians with hit rates, and bitcoin in 2014, 2018 and 2022 (Source: Yahoo Finance)
Two longer-run implications follow. A divided government lowers the probability of further fiscal stimulus, which may explain the rally in Treasuries. It also shifts attention back to the Federal Reserve’s December decision. The market-implied probability of a hike in December was 79 percent on 3 November, against 74.9 percent the day before.
With the CLARITY Act failing to advance in the Senate in September, the bill becomes a 2027 story rather than a driver of this week’s range. The Binance security incident of 29 October has faded, with withdrawals reopening on 3 November, and we see this as having minimal market impact.
Outlook: What Has Changed Since Monday’s Bitfinex Alpha
Monday’s base case remains intact: the support band holds and rallies toward $81,300 meet selling.
Since Monday, the band has absorbed both a close below $77,000 and an intraday test of the STH-CB without cascading liquidations, while OI and IV have eased. Against that, STH loss-taking has accelerated and ETF outflows have persisted.
The baseline now hinges on the STH-CB ($75,839) continuing to hold, rather than the original band floor ($77,000). Risks stay tilted towards a retest of $75,839 ahead of Friday’s non-farm payrolls data.
Core Baseline and Scenarios:
Base Case: Bitcoin trades between the $75,839 short-term holder cost basis and the $80,200 upper bound of the option-implied range through the 6 November expiry. Moves above $80,000 are likely to face selling pressure from holders of the 1.12 million BTC acquired between $81,000 and $84,000
Confirmation Triggers: Price acceptance above $77,000, positive net ETF inflows on 4 and 5 November, STH-SOPR reclaiming 1 and OI remaining below 700,000 BTC as funding cools towards five percent would confirm that support is no longer leverage-driven.
Invalidation Triggers: A daily settlement below $75,839 with aggregate supply in profit falling under 58 percent would expose the thin $70,000 to $75,000 liquidity pocket, where only around 540,000 BTC was acquired. A payrolls reading above 125,000 that pushes the probability of a December rate hike above 90 percent and the 10-year real yield past 2.8 percent would also challenge the base case.
The post ETF Outflows And Spot Selling Test Bitcoin’s Recovery appeared first on Bitfinex blog.