
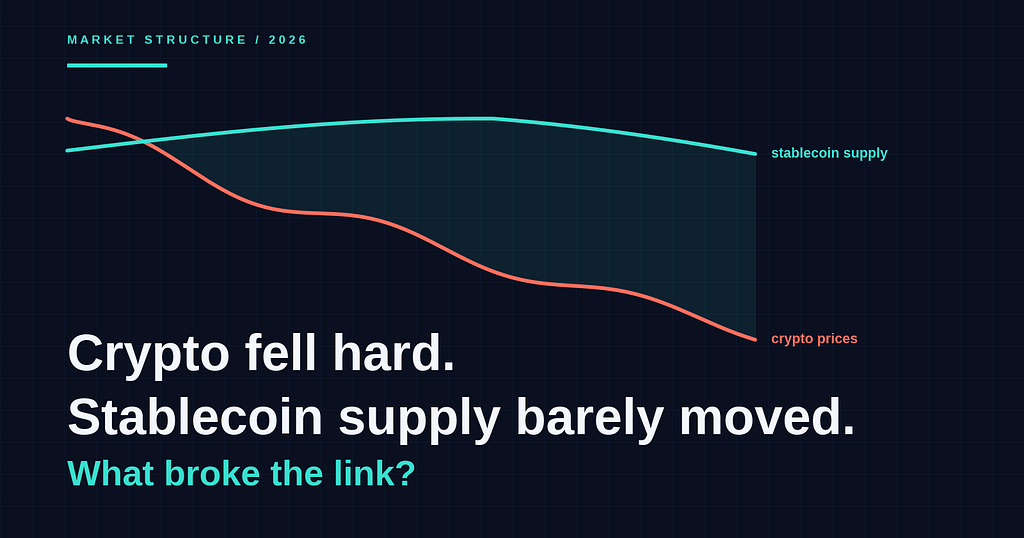
Prices are down roughly a third from the top. Dollar supply onchain is down 4.5%. That gap is the most important chart in crypto right now.
Two lines that used to move together. In 2026 they stopped.
Bitcoin’s record close was $128,198 on 6 October 2025. In late September 2026 it trades near $84,000.
Ethereum peaked at $4,953 in August 2025. It now sits around $2,670.
More than $810 billion of market value came off the board during the 2026 selloff.
Now look at the dollars.
Total stablecoin supply peaked at $322.4 billion on 17 May 2026. By 13 August it was $308.0 billion. That is a 4.5% drawdown, set against a price drawdown of roughly a third.
For a decade those two lines moved together. This year they did not.
Stablecoin supply vs crypto prices in 2026: what the numbers actually say
The gap is wider than most people realise. Here is the 2026 scoreboard.
Global crypto market capitalisation sat near $2.98 trillion in late September, with Bitcoin dominance around 56.5%Bitcoin is roughly 34% below its October 2025 recordEthereum is roughly 46% below its August 2025 record, and touched a 60% drawdown earlier in the yearTotal stablecoin supply is still up 14.3% year over year, from $269.4 billion in August 2025 to $308.0 billion in August 2026Stablecoins now account for around 13% of the entire crypto market by capitalisationRoughly 269 million onchain addresses held a stablecoin balance as of mid-2026Drawdown from cycle peak. Prices lost a third to a half. Dollar supply onchain lost 4.5%.
One more number makes the point properly. June 2026 set a record for adjusted stablecoin transfer volume at $1.79 trillion, in the same quarter that supply was falling.
Balances shrank. Usage grew. Those two things are not supposed to happen at once.
Forbes called it the first sustained contraction the sector had seen in four years.
The framing that stuck with me was simpler: supply falling while velocity climbed means the behaviour underneath the number changed.
Supply fell 4.5%. Prices fell roughly a third. In every previous cycle, those two numbers fell together.
Why stablecoin supply crashed 26% in 2022 but held firm in the 2026 bear market
The last downturn is the control group, and the contrast is brutal.
Combined stablecoin market cap fell from about $166 billion in March 2022 to $122 billion by September 2023, a contraction of more than 26%USDC alone dropped from $55 billion in July 2022 to below $24 billion by November 2023The 2026 pullback, by comparison, is the sharpest since 2023 and still only a few percent off the peakThe 2022 to 2023 contraction was a structural exit. The 2026 pullback is a rotation.
There is also a rehearsal worth noting. Between December 2025 and February 2026, supply contracted by roughly $9 billion, then recovered to a fresh record. Short contractions have become normal. Structural collapse has not.
So what changed? In 2022, most stablecoin balances were trading collateral. They existed to buy the next thing. When the next thing stopped looking attractive, holders redeemed and went home.
In 2026, a large share of those balances have a job that has nothing to do with the next trade.
What broke the link between stablecoin supply and the crypto cycle?
Three structural shifts, all of which landed inside eighteen months.
Regulation split the category in two
The GENIUS Act, signed in July 2025, prohibits payment stablecoin issuers from paying yield to holders, with the framework taking effect no later than 18 January 2027.
Hold a plain payment stablecoin and you are lending the issuer a dollar for free. That is now the law, not an accident of market structure.
Balances became working capital
Stablecoins are settling payroll, cross-border invoices, card spend and treasury operations. That demand does not care what Bitcoin did last week.
Yield replaced price expectation as the reason to hold
When a dollar onchain can generate a return from a transparent, verifiable source, the holder has a reason to stay through a drawdown.
That third shift is the one most commentary still misses. For scale: yield-generating instruments make up somewhere between 55% and 65% of traditional financial markets.
In crypto, the comparable figure has sat closer to 8% to 11%. The gap is not a quirk. It is a queue of capital waiting for a legitimate route.
If the money did not leave crypto, where did it actually go?
It rotated. The data on this is unusually clean.
In Q1 2026, tokenized treasuries added $2.12 billion in market cap while stablecoins added $1.19 billion, the first time tokenized treasuries outgrew stablecoins in absolute termsThe largest absolute supply gains among stablecoins went to yield-generating names, including USDY, sUSDS, USYC and syrupUSDCPayment-only supply leaked. Yield-generating supply gainedThe capital did not exit crypto. It moved from balances that pay nothing to balances that do.
This is the distinction that makes the headline number misleading. “Stablecoin supply fell” describes an average of two categories moving in opposite directions.
USDS is a useful illustration of the entry point, and sUSDS of the destination. USDS is the fully backed unit of account. sUSDS is the yield-generating version of it, redeemable at any time, with no lockups.
Why a governance-set savings rate behaves differently in a drawdown
Here is the part that actually explains the durability.
The Sky Savings Rate is a variable rate set by SKY-token-holder governance.
It is funded by Net Protocol Revenue generated when the Sky Agent Network, a set of independent capital allocators, draws USDS liquidity from Sky Protocol and deploys it into diversified strategies under public risk limits.
How the Sky Savings Rate is funded. No issuer marketing budget, and no dependence on funding rates staying positive.
Read that again with a market crash in mind. The rate does not depend on funding rates staying positive.
It does not depend on token prices. It depends on whether a diversified allocation network keeps generating revenue.
In 2026, it did. Per Sky Frontier Foundation:
Protocol Collateral grew 18.2% year over year to $11.10 billion at the August closeSky Agent Network vaults expanded from $5.63 billion to $6.06 billion during August aloneSky Protocol stablecoin supply closed August at $9.53 billion, up from $9.41 billion in JulyQ2 2026 delivered $107.35 million in Gross Protocol Revenue and $33.29 million in Net Protocol Surplus, the fifth consecutive positive quartersUSDS supply grew 149% year over year to $5.52 billion at the Q2 closeGrowth rates inside a shrinking market. The top line contracted. The savings layer underneath it did not.
A market shrinking 4.5% at the top line. A savings layer inside it growing at triple digits. That is the decoupling, in one comparison.
The question stopped being “where is the price going” and became “who is paying me to wait”.
Who is backing the structural demand argument with real money?
Institutions, and recently.
Token Terminal data as of 21 August placed Sky Protocol at $4.6 billion in tokenized funds, the largest single share of a $34.4 billion category, ahead of several far better-known issuers.
Then on 23 September, Galaxy added $100 million of sUSDS to its corporate balance sheet and approved it as eligible collateral across its institutional trading business.
Sky Agent Network exposure to Galaxy moved from $27 million at the Q2 close to roughly $304 million by 1 September.
An 11x increase in Sky Agent Network exposure to Galaxy in a single quarter, in the middle of a price drawdown.
Sky.money reported $7.1 billion across its full product suite on 19 August, of which $4.92 billion sat in the Sky Savings Rate.
None of that is speculative positioning. It is a treasury decision made during a drawdown.
Is falling stablecoin supply still a bearish signal for crypto prices?
Less than it used to be, and that is the honest answer.
Stablecoin supply was once a single-purpose gauge. It measured dry powder waiting on the sidelines. Today it measures at least three different behaviours at once:
Dry powder waiting to buyWorking capital moving through payment and settlement railsYield-generating balances that have no intention of leaving
When one number tracks three behaviours, the number stops being a signal and starts being noise.
A 4.5% drawdown tells you almost nothing about whether the next leg is up or down.
Better things to watch:
Net issuance split by category, payment versus yield-generatingAdjusted transfer volume rather than parked balances, and the underlying supply data behind bothCollateral composition and backing ratios, which you can verify onchain rather than inferWhether protocol revenue holds up when prices do not
What this actually means for the next cycle
The stablecoin market has stopped being a mirror of crypto prices. It has started behaving like a savings layer that happens to live onchain.
That changes what the metric is good for. Supply used to tell you about sentiment. Now it tells you about allocation.
And allocation, unlike sentiment, tends to be sticky.
If you want to check any figure in this piece rather than take my word for it, Sky Ecosystem publishes protocol collateral, revenue and supply data continuously.
So here is the question worth arguing about in the comments. If stablecoin supply no longer tracks the crypto cycle, what is the honest replacement metric for onchain liquidity? Net issuance by category? Transfer volume? Something else entirely? I do not think the market has settled on an answer yet, and I would rather hear a good disagreement than a consensus.
Crypto Fell Hard in 2026. Stablecoin Supply Barely Moved. What Broke the Link? was originally published in Coinmonks on Medium, where people are continuing the conversation by highlighting and responding to this story.