
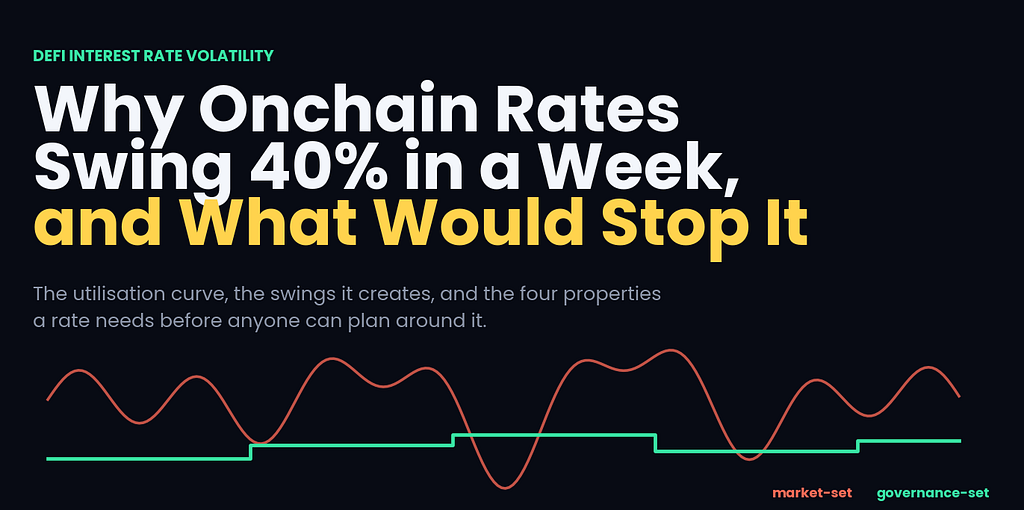
DeFi interest rate volatility is not a bug in the code. It is a design choice. Here is the mechanism behind the swings, and the four properties a rate needs before anyone can plan around it.
Why Onchain Rates Swing 40% in a Week, and What Would Stop It.
On 20 April 2026, an exploit drained roughly $292M from a liquid restaking token. Most stablecoin lenders had never touched it.
Within 24 hours, more than $6B walked out of Aave. USDT and USDC pools hit 100% utilisation. Depositors who wanted out could not get out, so around $300M was borrowed against their own trapped stablecoins.
No treasury bill defaulted that week. No loan went bad. No yield source changed.
The rate moved anyway.
That gap, between what a rate is supposed to measure and what it actually measures, is the whole story of DeFi interest rate volatility.
And it is the reason a growing number of treasury desks have stopped asking “what is the yield” and started asking “what is the rate a function of.”
A 40% Swing Is Not an Outlier. It Is the Base Case.
Look at the last eighteen months of stablecoin lending rates.
For most of 2025, stablecoin supply rates on Aave sat between 3% and 5%.Late January 2026, they crossed 8%.Early February, 12%.By mid-March, Aave V3 on Ethereum was showing 15.2% on USDC and 14.8% on USDT. Compound V3 sat at 13.9%. Morpho reached 16.1% on selected stablecoin markets.By May, Aave’s trailing 30-day USDC supply APY was back down to a 3.8% to 5.2% band.
The driver was leverage, not productivity. Outstanding DeFi loans grew from $18.4B at the start of 2026 to $31.7B by mid-March. That is a 72% jump in eleven weeks.
Same dollars. Same collateral. Same code. A rate that tripled and then gave it all back.
Against that series, a 40% weekly move barely registers as news. It is Tuesday.
Aave USDC supply rate versus the Sky Savings Rate, mid-2025 to May 2026.
The Utilisation Curve: DeFi’s Rate Engine in Sixty Seconds
Most onchain lending markets price with a kinked utilisation curve. Aave V3 calls the bend the optimal usage ratio. Compound calls it the kink. The idea is identical.
Below the kink, the borrow rate climbs on a gentle slope.Above it, the rate climbs on a punishing one.Supplier yield is borrower interest minus a reserve factor.Every parameter in that curve is set by governance, per asset, per market.
The standard worked example: with a kink at 80% utilisation, the borrow rate might sit at 15%. Push utilisation to 89% and it jumps to 33%.
Nine points of utilisation. Eighteen points of rate.
The utilisation curve does not measure how much money the system made. It measures how full the pool is. Those are very different questions.
That is why a withdrawal panic and a genuine credit event produce the same signal. The curve cannot tell them apart, because it was never built to.
The kinked two-slope utilisation curve, illustrated at an 80% kink.
Why Do DeFi Rates Change? Three Forces, None of Them Revenue
Leverage demand. Traders borrow stablecoins to buy more crypto. Utilisation climbs, rates climb with it. Sentiment, priced by the block.Liquidity flight. April 2026 is the cleanest case on record. An exploit somewhere else emptied the pool here, and the curve did what curves do.Funding rates. Delta-neutral products inherit perpetual futures funding. Ethena’s sUSDe has printed anywhere from roughly 4% to 30% and above across cycles, sat near 3.72% in early 2026, then compressed to around 4.5% by June. That is not mismanagement. That is the design working exactly as specified.
None of the three measures what the underlying capital actually earned. They measure crowding, fear, and positioning. Useful signals. Terrible benchmarks.
Leverage demand, liquidity flight and funding rates.
What Real Benchmarks Have That Onchain Rates Mostly Do Not
SOFR is a useful mirror here. Not because traditional finance is smarter, but because benchmark administration is a solved problem over there.
An administrator. The New York Fed publishes SOFR every US business day at around 8:00am ET.Deep inputs. More than $1 trillion of daily repo transactions sit behind the print.A published methodology. Anyone can read exactly how the number is produced.A complaints process. You can formally challenge a print, in writing, and get a response.
On 13 August 2026, SOFR was 3.62%. It got there in small, documented moves.
Most onchain rates have none of that. They have a formula and a mempool. The formula is honest, the mempool is not editorial, and the output is still a number nobody can underwrite a term loan against.
The Fix Is Boring: Fund the Rate From Revenue, Not From Scarcity
This is where Sky Ecosystem is built differently, and the mechanism is worth walking through rather than the marketing.
Sky Ecosystem is a global savings and capital allocation network. The Sky Savings Rate is its output, accessed through sUSDS. The pipeline runs like this.
Sky Agents borrow. Independent capital allocators such as Spark and Grove borrow USDS from Sky Protocol at a wholesale cost of capital called the Base Rate. They are sovereign businesses, not subsidiaries.Agents deploy and settle. They run their own strategies and repay the Base Rate through a Monthly Settlement Cycle, where two teams calculate the amounts independently and Core GovOps reconciles them before an onchain vote authorises settlement.Revenue pools. Those payments, plus vault stability fees, RWA yield and PSM fees, land in the Surplus Buffer, the protocol’s first loss-absorbing layer.Governance sets the rate. SKY token holders set the Sky Savings Rate as a separate parameter, calibrated against total revenue capacity and reserve targets.Surplus is retained. What is left above the payout builds Sky Reserves instead of being handed straight out.
The consequence is the part people miss. The Sky Savings Rate moves in discrete, published steps when Sky Governance decides revenue or reserves warrant it. It does not reprice because someone pulled $6B out of a pool on a Monday.
There is also a bounded fast path. Stability parameters can be adjusted inside pre-set floors, ceilings and step sizes, with a mandatory cooldown between moves, so the rate can respond to a shifting external environment without a rate that is free to do anything it likes.
How Sky Protocol revenue becomes the Sky Savings Rate.
The Numbers Behind a Governance-Set Rate
A rate funded by revenue is only as steady as the revenue. So here is the revenue.
From the Q2 2026 report published by Sky Frontier Foundation in July:
Gross Protocol Revenue of $107.35M, up 10.5% year over year, a second straight quarter above $100M.Net Protocol Revenue of $40.09M, up 25%, with net margin at 37.3%.Protocol Collateral of $12.32B against $12.22B in Protocol Obligations, producing a Protocol Surplus of $90.26M.sUSDS up 149% year over year to $5.52B, with cumulative sUSDS distributions past $250M since inception.Prime Agent Vaults of $6.84B, roughly 55% of Protocol Collateral, including allocations to Janus Henderson, BlackRock BUIDL, Anchorage and PayPal.
All of it sits on a live financial dashboard rather than a quarterly PDF, with the monthly write-ups published on Sky Ecosystem Insights. In August 2025, S&P Global Ratings assigned Sky Protocol a ‘B-’ issuer credit rating, the first it had ever given a DeFi protocol.
Sky Protocol Q2 2026 headline figures.
The Trade-off Nobody Puts in the Deck
Governance-set rates are not free. Three honest costs.
You will not catch the 15.2% week. A rate calibrated to revenue lags a rate calibrated to panic, in both directions.Governance can be slow, and governance can be wrong. Parameter changes are a human process with human incentives attached.S&P still scores USDS and DAI peg stability at 4, or constrained, and flagged depositor concentration and governance concentration when it rated the protocol.
That is the trade. Lower ceiling, narrower band, published reasoning. The Sky Savings Rate showed 4.00% APY on skyeco.com at the time of writing, and it is variable and governance-set, so check the live figure before quoting it anywhere.
So What Would Actually Stop the Swings?
Four properties. None of them exotic.
Fund the rate from realised revenue, not from pool scarcity.Move it in bounded, discrete steps on a published cadence.Hold a loss-absorbing buffer so a short-term gap does not force an emergency reprice.Publish the financials continuously, so anyone can check the maths without asking permission.
Onchain finance already has the third and fourth in places. The first two are still rare.
Every serious credit market eventually grows a reference rate. Not because a regulator mandated one, but because you cannot price a two-year loan against a number that reprices when a restaking token gets exploited on a Monday morning.
Here is the part worth arguing about in the comments. If a governance-set benchmark is more predictable but structurally lower than a utilisation-driven one, is that a better rate for onchain capital, or just a slower one? And if you are running a treasury today, which of those four properties would you refuse to give up?
Tell me where you land, and why.
Why Onchain Rates Swing 40% in a Week, and What Would Stop It was originally published in Coinmonks on Medium, where people are continuing the conversation by highlighting and responding to this story.