A 30-day tactical plan for June — no leverage, no squeeze fantasy, just the actual data.
It dropped to $67,468 intraday today.
The trigger was Iran suspending US peace talks and threatening to fully reseal the Strait of Hormuz. Trump says a deal is reachable within a week. Maybe. But oil spiked above $95 before pulling back to $94.58, and that’s the number I actually care about right now. Not BTC’s price. The oil print.
This is how I think about it: oil leads inflation. Inflation locks the Fed. The Fed locks liquidity. Locked liquidity crushes risk assets. Bitcoin is a risk asset. The chain is intact.
So before I tell you what I’m doing, let me tell you what I’m not doing. I’m not chasing a short squeeze.
The “22x short squeeze” story doesn’t hold up
I saw a report circulating that framed this setup as a massive short-squeeze opportunity, supposedly with $486M in longs against $10.89 billion in shorts — a 22-to-1 imbalance screaming for a squeeze.
I looked at CoinGlass directly. The actual one-week liquidation map is roughly balanced: about $1.29B in long liquidations below $73,786 and $1.22B in short liquidations above $80,995.
Not 22-to-1. Not even close.
Short-side clusters are sitting in the high-$70Ks and above $80K, which is far above where we’re trading right now. Any rally to those levels would require real demand. It can’t be liquidation-driven from here. So if you’re sizing for a squeeze that the data doesn’t support, I’d think carefully about that.
What the market actually looks like right now
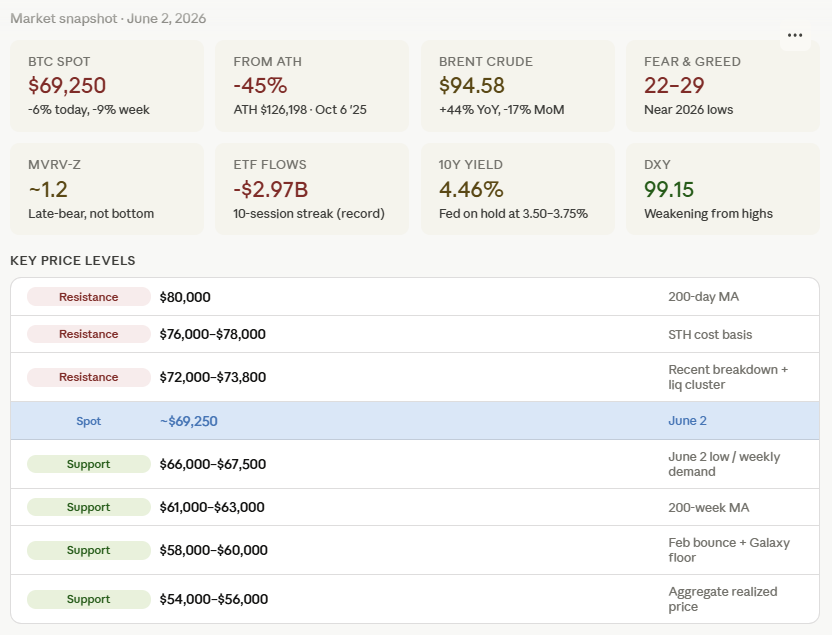
BTC is at roughly $69,250 as I write this, down about 45% from the October 2025 all-time high of $126,198. That’s not a crash, exactly. It’s a confirmed cyclical bear drawdown, tracking at the milder end of historical post-ATH declines (prior cycles ran 76–93%).
Fear and Greed is sitting between 22 and 29, near 2026 lows. MVRV-Z is around 1.2, which is late-bear territory but not the sub-0.5 reading that marks a generational bottom. The 200-week moving average is around $61–63K. The aggregate realized price, which is basically the average cost basis for everyone in the market, is around $54–57K.
Those two numbers, the 200-week MA and the aggregate realized price, are the levels I’m building my accumulation plan around. Not the current price.
Here’s the other thing that caught my attention: realized volatility hit a multi-year low on June 1st. That’s historically a precursor to a large directional move. It doesn’t tell you which direction. But something is coming.
The Iran situation is binary. Treat it that way.
I want to be direct about something that’s uncomfortable to sit with: the most important input for Bitcoin over the next 30 days isn’t on-chain data. It’s not the FOMC meeting. It’s the Strait of Hormuz.
If Iran fully recloses it, Brent re-accelerates above $100. That re-accelerates inflation. That keeps the Fed frozen or worse, pushes them toward a December hike. Bitcoin probably tests the low $60Ks and possibly lower.
If Iran backs down and a deal materializes, Brent could break below $85. That changes the CPI trajectory in 60–90 days. That changes the Fed calculus. That’s the strongest near-term bull case.
I genuinely don’t know which happens. Trump says a deal is close. Iran says they’re pulling back from talks. Both can be true or neither can be true. I’m treating oil headlines as the single most important real-time input right now, and I’m watching Brent before I touch any position sizing.
The June 16–17 FOMC is probably more important than people realize
Kevin Warsh was sworn in as Fed chair on May 22nd. June 16–17 is his first FOMC meeting and first dot-plot.
Markets are pricing a near-certain hold, roughly 97–98% implied probability. So the rate decision itself is a non-event. What matters is the dot-plot. If the dots signal a 2026 hike, that’s a clear Bitcoin negative. If Warsh sounds unexpectedly dovish, that’s the strongest near-term bullish catalyst available.
JPMorgan is projecting zero 2026 cuts. Markets are pricing roughly 46–60% odds of a December hike. That’s the context. This isn’t a pivot narrative. It’s a “how hawkish will the new chair be” question.
Here’s my 30-day scenario breakdown
My base case, at 45% probability, is choppy consolidation between $66K and $76K. Oil stays rangebound, FOMC holds as expected, outflows stabilize. Bitcoin bases above the $66K weekly demand zone but doesn’t reclaim the $76–78K short-term holder cost basis, which is where recent buyers are underwater. That overhead supply matters.
The bear case, at 35%, is a break lower into $58K–$66K. That’s a Hormuz reclosure with oil re-spiking, or a hawkish dot-plot, or both. A break below $66K tests the 200-week MA at $61–63K and potentially $58K, which is the February bounce zone and what Galaxy Digital called their “line in the sand.”
The bull case, at 20%, is a move back to $76K–$84K. That requires Iran de-escalation, a dovish FOMC surprise, and ETF flows flipping positive. Possible, but I’m not building a plan around it.
Notice the bear probability is higher than in my prior framework. That’s because the oil situation deteriorated this week and I’m not going to pretend otherwise.
Strategy’s first BTC sale since 2022 — what it actually means
Strategy filed an 8-K on June 1st. Between May 26 and 31, they sold 32 BTC at an average of $77,135 to fund preferred dividends on their STRC shares. It’s $2.5 million. They still hold 843,706 BTC. This isn’t a forced liquidation.
But there’s a pivot point I’m watching. CEO Phong Le defined 1.22x mNAV as the threshold: above it, they issue equity and buy BTC. Below it, the model flips toward cash preservation and BTC sales. Their USD reserve dropped to $900 million as of May 31st, down from over $2 billion after they retired convertible notes.
If mNAV breaks below 1.0 and cash drops below $500M, the forced-sale narrative becomes real. For now it isn’t. But I’m tracking the 8-K filings.
My accumulation plan
Here’s the thing about accumulating during a bear market: the instinct is to buy now because it feels like a discount. But $69K is still above most of the confluence zones that have anchored every prior cycle bottom.
The 200-week MA is at $61–63K. The aggregate realized price is $54–57K. The cycle-analog bottom window, based on the historical 12–13 month post-ATH pattern, points to around October 2026. Buying aggressively at $69K means deploying ammunition into overhead resistance.
So here’s how I’m structuring it.
The core principle is that only about 20% of my dry powder goes above $60K. The highest-conviction zone, roughly 45% of my total allocation, is reserved for the $54K–$60K band. That’s where the 200-week MA, the aggregate realized price, and the cycle timing all cluster.
The ladder runs down to $38–40K as a tail risk tranche. I hope I never need it. But it’s there.
The oil override matters. If Brent breaks above $100 on a confirmed Hormuz reclosure, I pause all buying. I don’t average down into an accelerating macro deterioration. I wait for lower entries.
What I’m watching on-chain before calling a bottom
I’m not calling a bottom at $69K, or $60K, or anywhere specific. What I’m doing is running a checklist. When multiple signals converge, that’s when I start getting aggressive.
The checklist: MVRV-Z below 0.5 (currently at 1.2, so not there). aSOPR and STH-SOPR sustained below 0.90 (we saw capitulation-adjacent readings in Q1 but not the deep, sustained prints that mark generational lows). Fear and Greed below 15 (briefly hit 5 in February, so watch for that). Price testing or undercutting the 200-week MA. ETF outflows reversing to sustained inflows. Funding deeply negative then flipping positive.
I want several of those at once. One isn’t enough. The record 15.8 million BTC in long-term holder supply that people are citing as a bullish signal is actually, in my view, a buyer drought signal. It means short-term holders have exited but new buyers aren’t replacing them. Whale wallets between 1,000 and 10,000 BTC are contracting at the fastest pace of 2026. That’s not accumulation. That’s distribution.
The full catalyst map for June
The two events I’m treating as highest priority this month: the May CPI print on June 10th and the FOMC on June 16–17th. Both happen before this article is a week old for most people reading it.
CPI at 3.4% or below changes the conversation. CPI at or above 3.8% (April’s number) reinforces the hike narrative. Everything else in June is secondary.
Where I might be wrong
The four-year cycle analog is real but I’m weighting it lower than before. ETF structure and institutional participation have changed the volatility profile. Prior cycles drew down 76–93%. We’re at 45%. Either this is structurally different, or the second leg lower hasn’t arrived yet. I’m positioning for both.
The cycle bottom timing in October 2026 is a base case, not a guarantee. The macro shock could push it out. The institutional structure could pull it forward. I’m holding the timeline loosely and letting the on-chain checklist drive the timing call.
One more thing: Bloomberg’s Eric Balchunas called the $3B in ETF outflows “totally meaningless compared with normal ETF flow patterns.” Cumulative net flows are still around $57B. The structure of institutional demand is intact. What’s missing is new demand. That’s the thing to watch for.
Where do you think BTC finds its cycle low, and are you accumulating here or waiting for the $54–60K zone? I’m genuinely curious what other macro-first traders are doing right now.
Not financial advice. I hold BTC and have open limit orders at several of the levels described. Spot only, zero leverage. Do your own research.
A 30-Day Bitcoin Tactical Plan While Everyone Panics About $69K was originally published in Coinmonks on Medium, where people are continuing the conversation by highlighting and responding to this story.