Uniswap V3 returns depend far more on price movement and range selection than on APR.
By simulating real scenarios — flat markets, drops, and rallies — you can measure:
• daily fee income
• break-even time after drawdowns
• realistic upside
Stress-testing turns LP from guessing into strategy.
We all see attractive APR numbers on DeFi dashboards — but they don’t show what actually happens when price moves.
In Uniswap V3, liquidity only earns fees inside a chosen range. Once price leaves that range, fee income stops and your position becomes fully exposed to one asset.
To understand real risk and reward, we stress-tested a Uniswap V3 position using real scenarios instead of assumptions.
Position Setup
For this test, we modeled a realistic LP position:
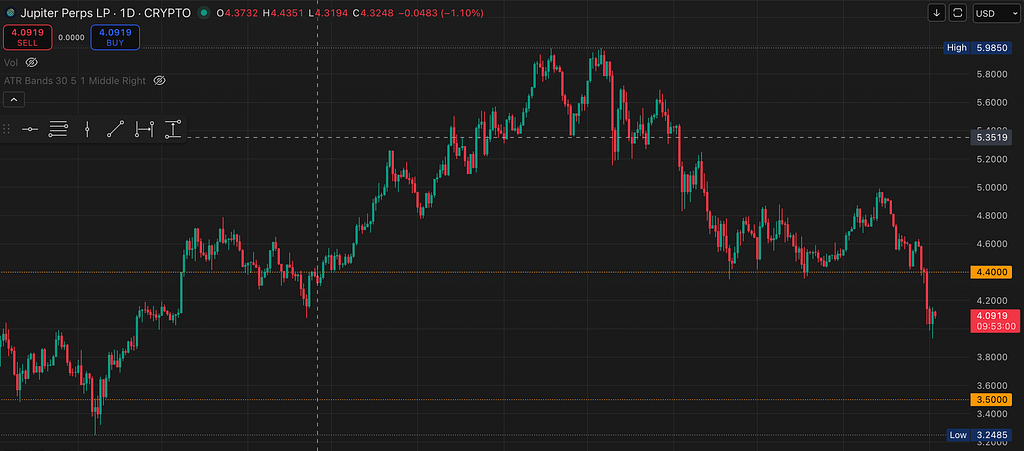
Pair: JLP / USDC
Capital: $10,000
Entry price: $4.09
Active range: $3.50 — $4.40
Goal: measure daily fees, downside recovery time, and upside performance.
Starting liquidity position with defined price range around current market price.
Scenario 1 — Stable Price (Baseline Yield)
First, we simulated 24 hours with price staying flat inside the range.
Result:
→ ~$8.22 earned in fees per day
This gives a realistic baseline — not APR, but actual daily income.
Fee income grows steadily while price remains inside the active range.
Scenario 2 — Price Drops to $3.85
Next, we stress-tested a bearish move.
From $4.09 → $3.85:
• After 10 days: still in drawdown
• After 30 days: close to break-even
• Around day 33: fees fully offset losses
Break-even time: ~33 days
This shows exactly how long you’d need to stay in the position to recover.
Fee income gradually compensates losses caused by downward price movement.
Scenario 3 — Price Rises to $4.25
Now a bullish case — price rises but remains inside the range.
Over 10 days:
• ~$82 in fees
• Additional value from price appreciation
Net result: +$174 (~1.7% ROI)
Fees and price movement worked together.
Profit driven by both fee income and upward price movement within the range.
What These Scenarios Reveal
Instead of guessing, we now know:
✔ realistic daily yield
✔ downside recovery timeline
✔ upside potential inside range
This is the information APR alone never provides.
Why Stress-Testing Matters in Uniswap V3
Uniswap V3 positions behave like active strategies.
Returns depend on:
• volatility
• time inside range
• range width
• price direction
Without simulation, you’re blind to how these forces interact.
Stress-testing makes risk measurable.
Making Simulation Part of the Process
After running scenarios manually, it became clear that interactive modeling is far more effective than spreadsheets or APR dashboards.
Being able to adjust price paths and ranges and instantly see:
• fee accumulation
• impermanent loss
• token balance shifts
changes how you approach LP decisions.
That’s why we built a lightweight Uniswap V3 simulator that runs directly in the browser:
• free to use
• no accounts
• no tracking
• works offline once loaded
It’s designed specifically for stress-testing positions before entering pools: https://qalc.ai/defi/uniswap-v3-simulator
How to Stress-Test Uniswap V3 Positions (Real Scenarios, Real Numbers) was originally published in Coinmonks on Medium, where people are continuing the conversation by highlighting and responding to this story.