
Ethereum (ETH) continues to trade near the $3,250 mark after facing pressure at key resistance levels. The asset remains above key support levels despite recent price rejection.
Resistance Blocks Further Upside
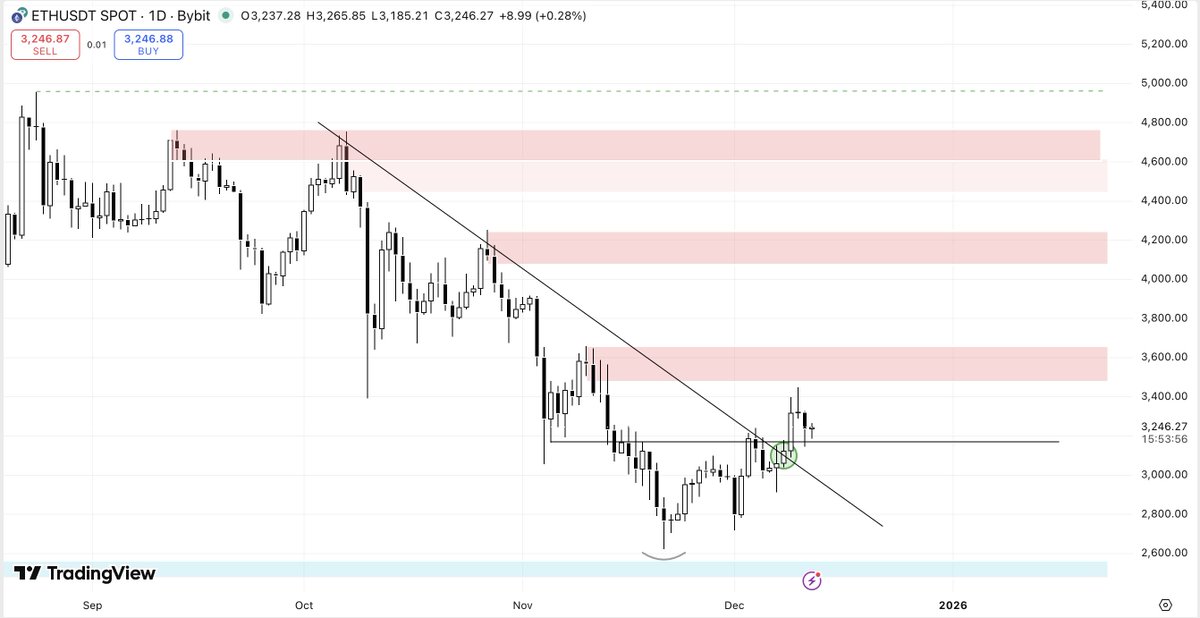
Ethereum attempted to push through the $3,350 zone but failed. This area includes the 200-day moving average and a key horizontal resistance level. Since that rejection, the price action has cooled, but ETH has not broken below the recent higher lows formed in November. Daan Crypto Trades noted,
“$ETH rejected from its Daily 200MA/EMA and ~$3,350 horizontal level.”
He also pointed out that ETH is still outperforming much of the broader market. While momentum has slowed, the trend since November remains upward. Moreover, after breaking a descending trendline, ETH pulled back to retest it. The price action is holding just above that line, which has served as resistance since October. If it continues to hold, it could support a move higher.
DonnieBTC commented that ETH is “retesting the trend line” and appears “ready for a new bounce.” The next resistance sits in the $3,600 to $3,800 range, while immediate support is at $3,000. A higher low near this level would likely confirm that the uptrend is still valid.
Ethereum (ETH) Price Chart 12.12. Source: DonnieBTC/X
Past Pattern Repeats?
ETH’s recent 47% pullback matches a similar decline from mid-2024. That correction was followed by a strong move upward. A new weekly chart comparison from CryptoWZRD suggests the two structures are nearly identical in both size and timing. A similar recovery now would echo the late 2024 rally.
In addition, CryptoWZRD stated that ETH closed indecisively in the daily candle, and ETHBTC was weak. Resistance and support levels are identified at 3,700 and 2,800, respectively.
“Further upside from ETHBTC is needed and will depend on a decline in Bitcoin Dominance.”
Meanwhile, Ethereum’s social sentiment shifted after the recent Fed rate decision. Initial excitement around a rate cut faded quickly as ETH pulled back. However, data from CryptoQuant shows early signs of buyer activity returning. Analyst Maartunn noted, “Net Taker Volume is still negative at –$138M,” though it has improved from October, when it reached –$500M.
Exchange data also shows modest inflows into ETH spot ETFs after weeks of outflows. Glassnode reported early signs of recovery, with demand appearing to stabilize. These inflows suggest that some investors are positioning for strength as the year ends.
The post Ethereum Slams Into Major Resistance: Breakout or Breakdown Ahead? appeared first on CryptoPotato.