
TL;DR
ADA’s price surged to almost $0.40, potentially driven by positive metrics such as an increase in large transactions.
However, its RSI recently spiked to 81, suggesting overbought conditions and a potential correction despite predictions of further rallies from analysts.
ADA’s Resurgence
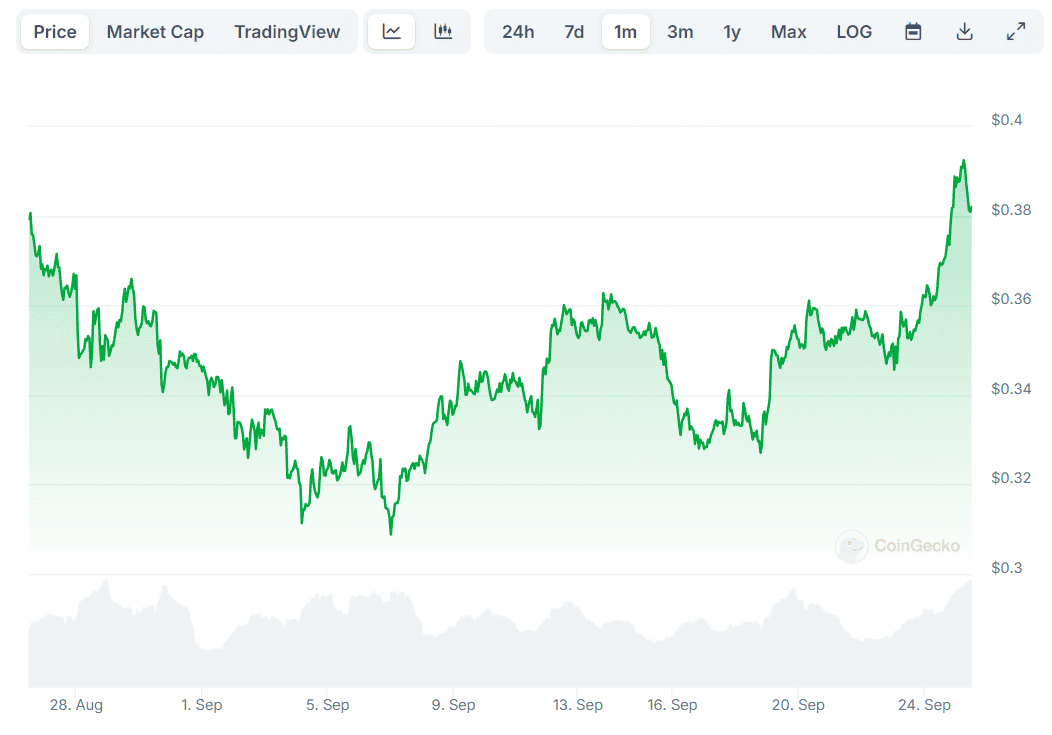
Cardano’s ADA has been among the top-performing leading digital assets in the last 24 hours, with its price hitting a one-month peak of over $0.39. Its market capitalization pumped to $14 billion (and retraced a bit since), making it the 11th-largest cryptocurrency.
Its revival aligns with three important metrics that have been on the rise. The first (somewhat expectedly) is the “In the Money” indicator, which, according to IntoTheBlock, is up 10.5% on a daily scale. It measures the change of ADA investors currently sitting on paper profits. As of now, 31% of those are in the green, while 66% are underwater.
The stats looked much worse during the crypto market crash at the beginning of August. Back then, ADA’s price plummeted to a seven-month low of $0.27, while only 0.35% of its holders were sitting on some profits on their initial investments.
The second bullish factor is the large transaction volume (where each on-chain ADA transaction exceeds $100,000). The figure reached $6.6 billion on September 25, representing a 12% increase in 24 hours.
Last but not least, we will focus on ADA’s NVT (network value to transactions) ratio. The metric is currently set at around 2.7, which is considered low. It indicates that the token is undervalued and, hence, ready for a potential rally.
One popular analyst who recently predicted a further pump for Cardano’s native token is the X user CryptoBullet. The trader expects the price to reach a lower high of around $1.80 sometime next year. However, they assumed it may later head south to roughly $0.15.
The Bearish Element
Conversely, ADA’s Relative Strength Index (RSI) suggests the asset could be poised for an imminent correction. The analysis tool measures the change and speed of price movements, varying from 0 to 100.
Readings above 70 signal that the token might be overbought, while anything below 30 is considered bullish since it indicates oversold conditions. Currently, the RSI is hovering around 70, briefly spiking to 81 on September 24.
The post Cardano Reaches 1-Month High: 3 Bullish Signs Point to a Potential ADA Bull Run appeared first on CryptoPotato.