Bitcoin’s price has been recovering over the past couple of weeks. The market is in a critical area, which could determine its mid-term future.
Technical Analysis
By Edris Derakhshi (TradingRage)
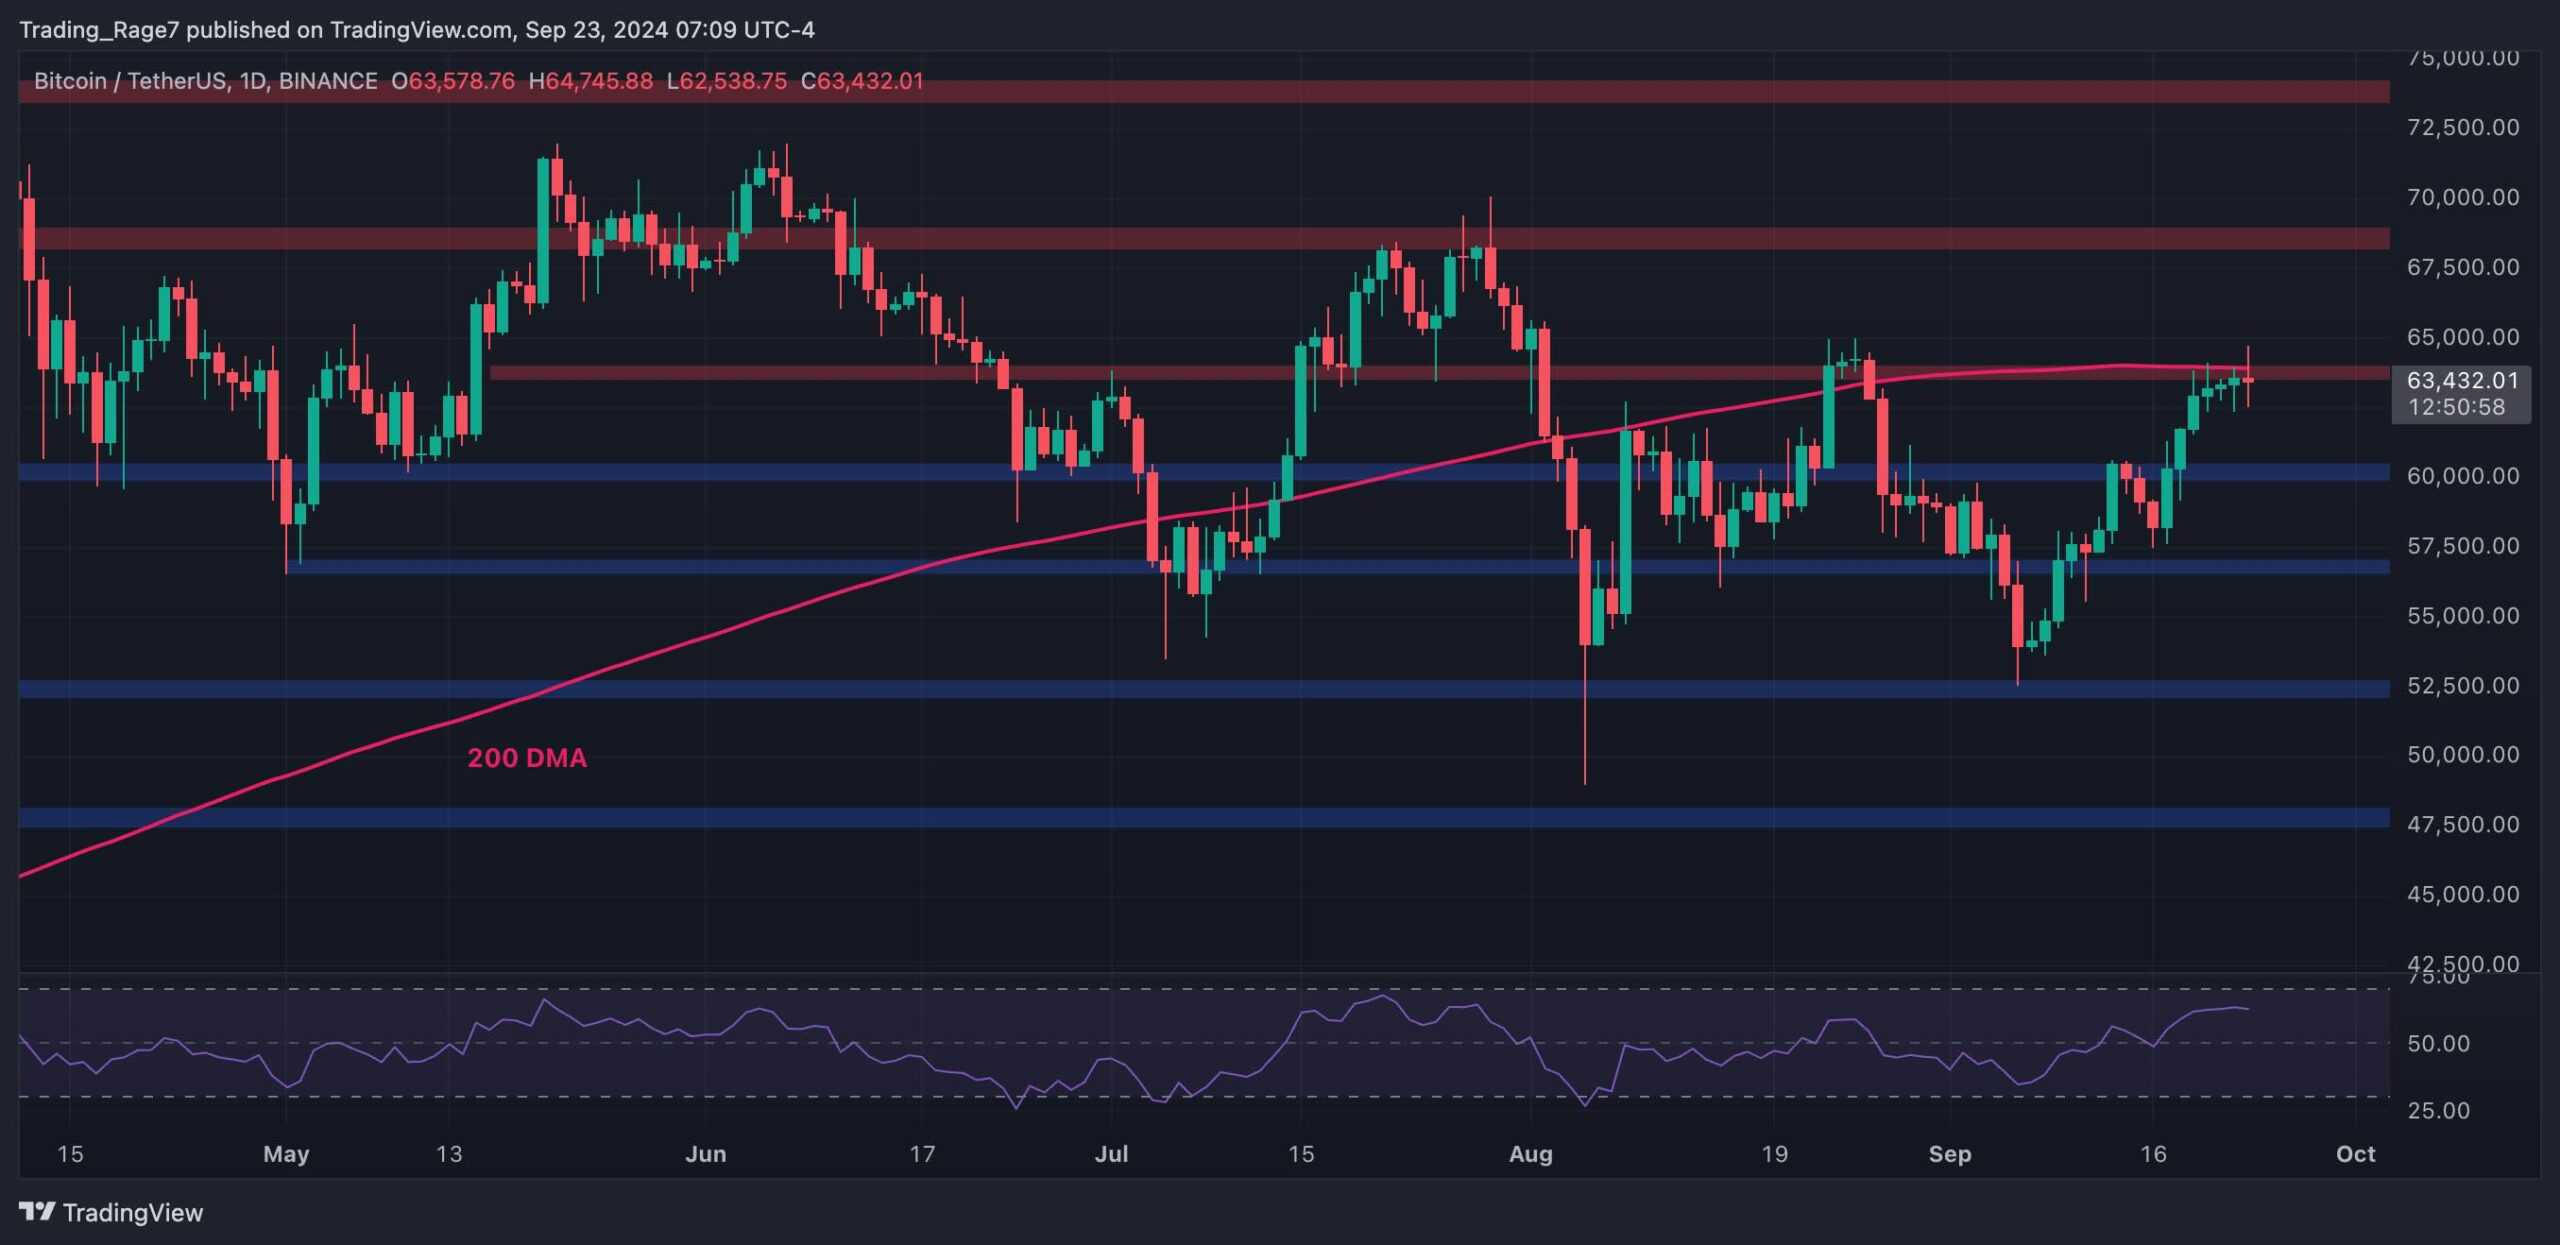
The Daily Chart
The daily chart shows that the price has risen since bouncing from the $52,500 support level earlier this month. Over the last few weeks, BTC has reclaimed the $57K and $60K levels. Yet, the 200-day moving average alongside the key $64K level remains intact, as the market has been testing it consistently recently.
A bullish breakout would likely pave the way for a new all-time high in the coming weeks. A continuation is highly likely, with RSI also showing values above 50%.
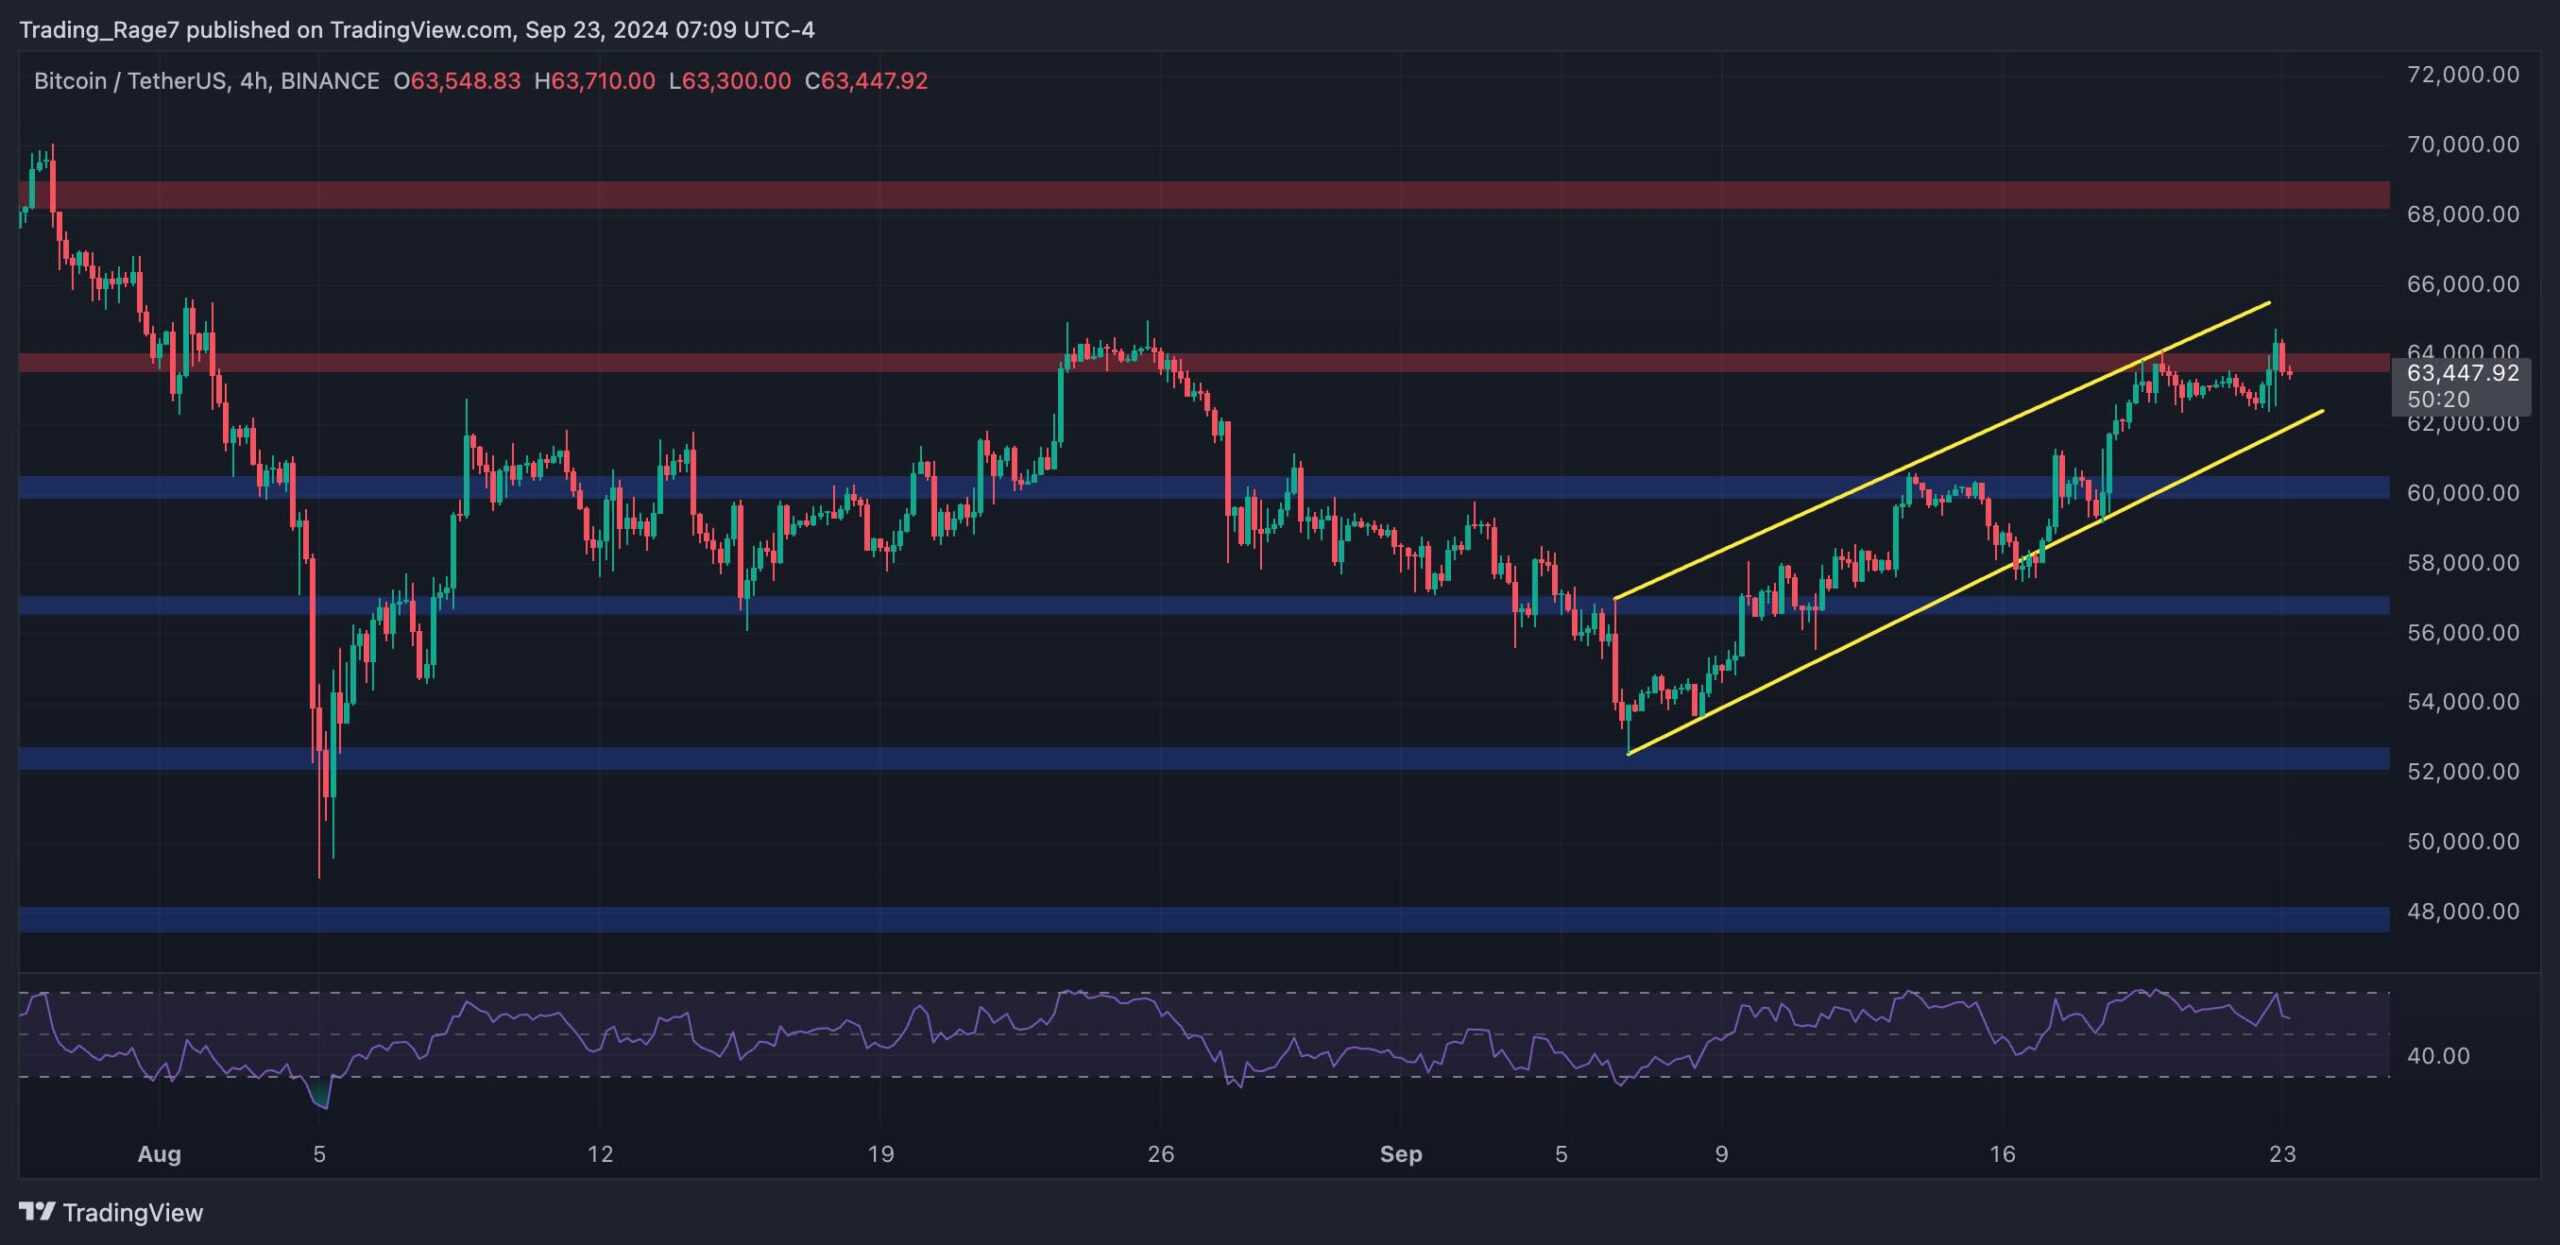
The 4-Hour Chart
The 4-hour chart demonstrates a clear uptrend, as the price has increased and decreased. However, with the market gradually rising inside an ascending channel, there is a possible scenario for a decline.
If the $64K resistance level rejects the price and the channel breaks to the downside, a drop toward $60K and even $57K is possible. Meanwhile, as the daily timeframe suggests, there is still a significant probability of further upside.
On-Chain Analysis
By Edris Derakhshi (TradingRage)
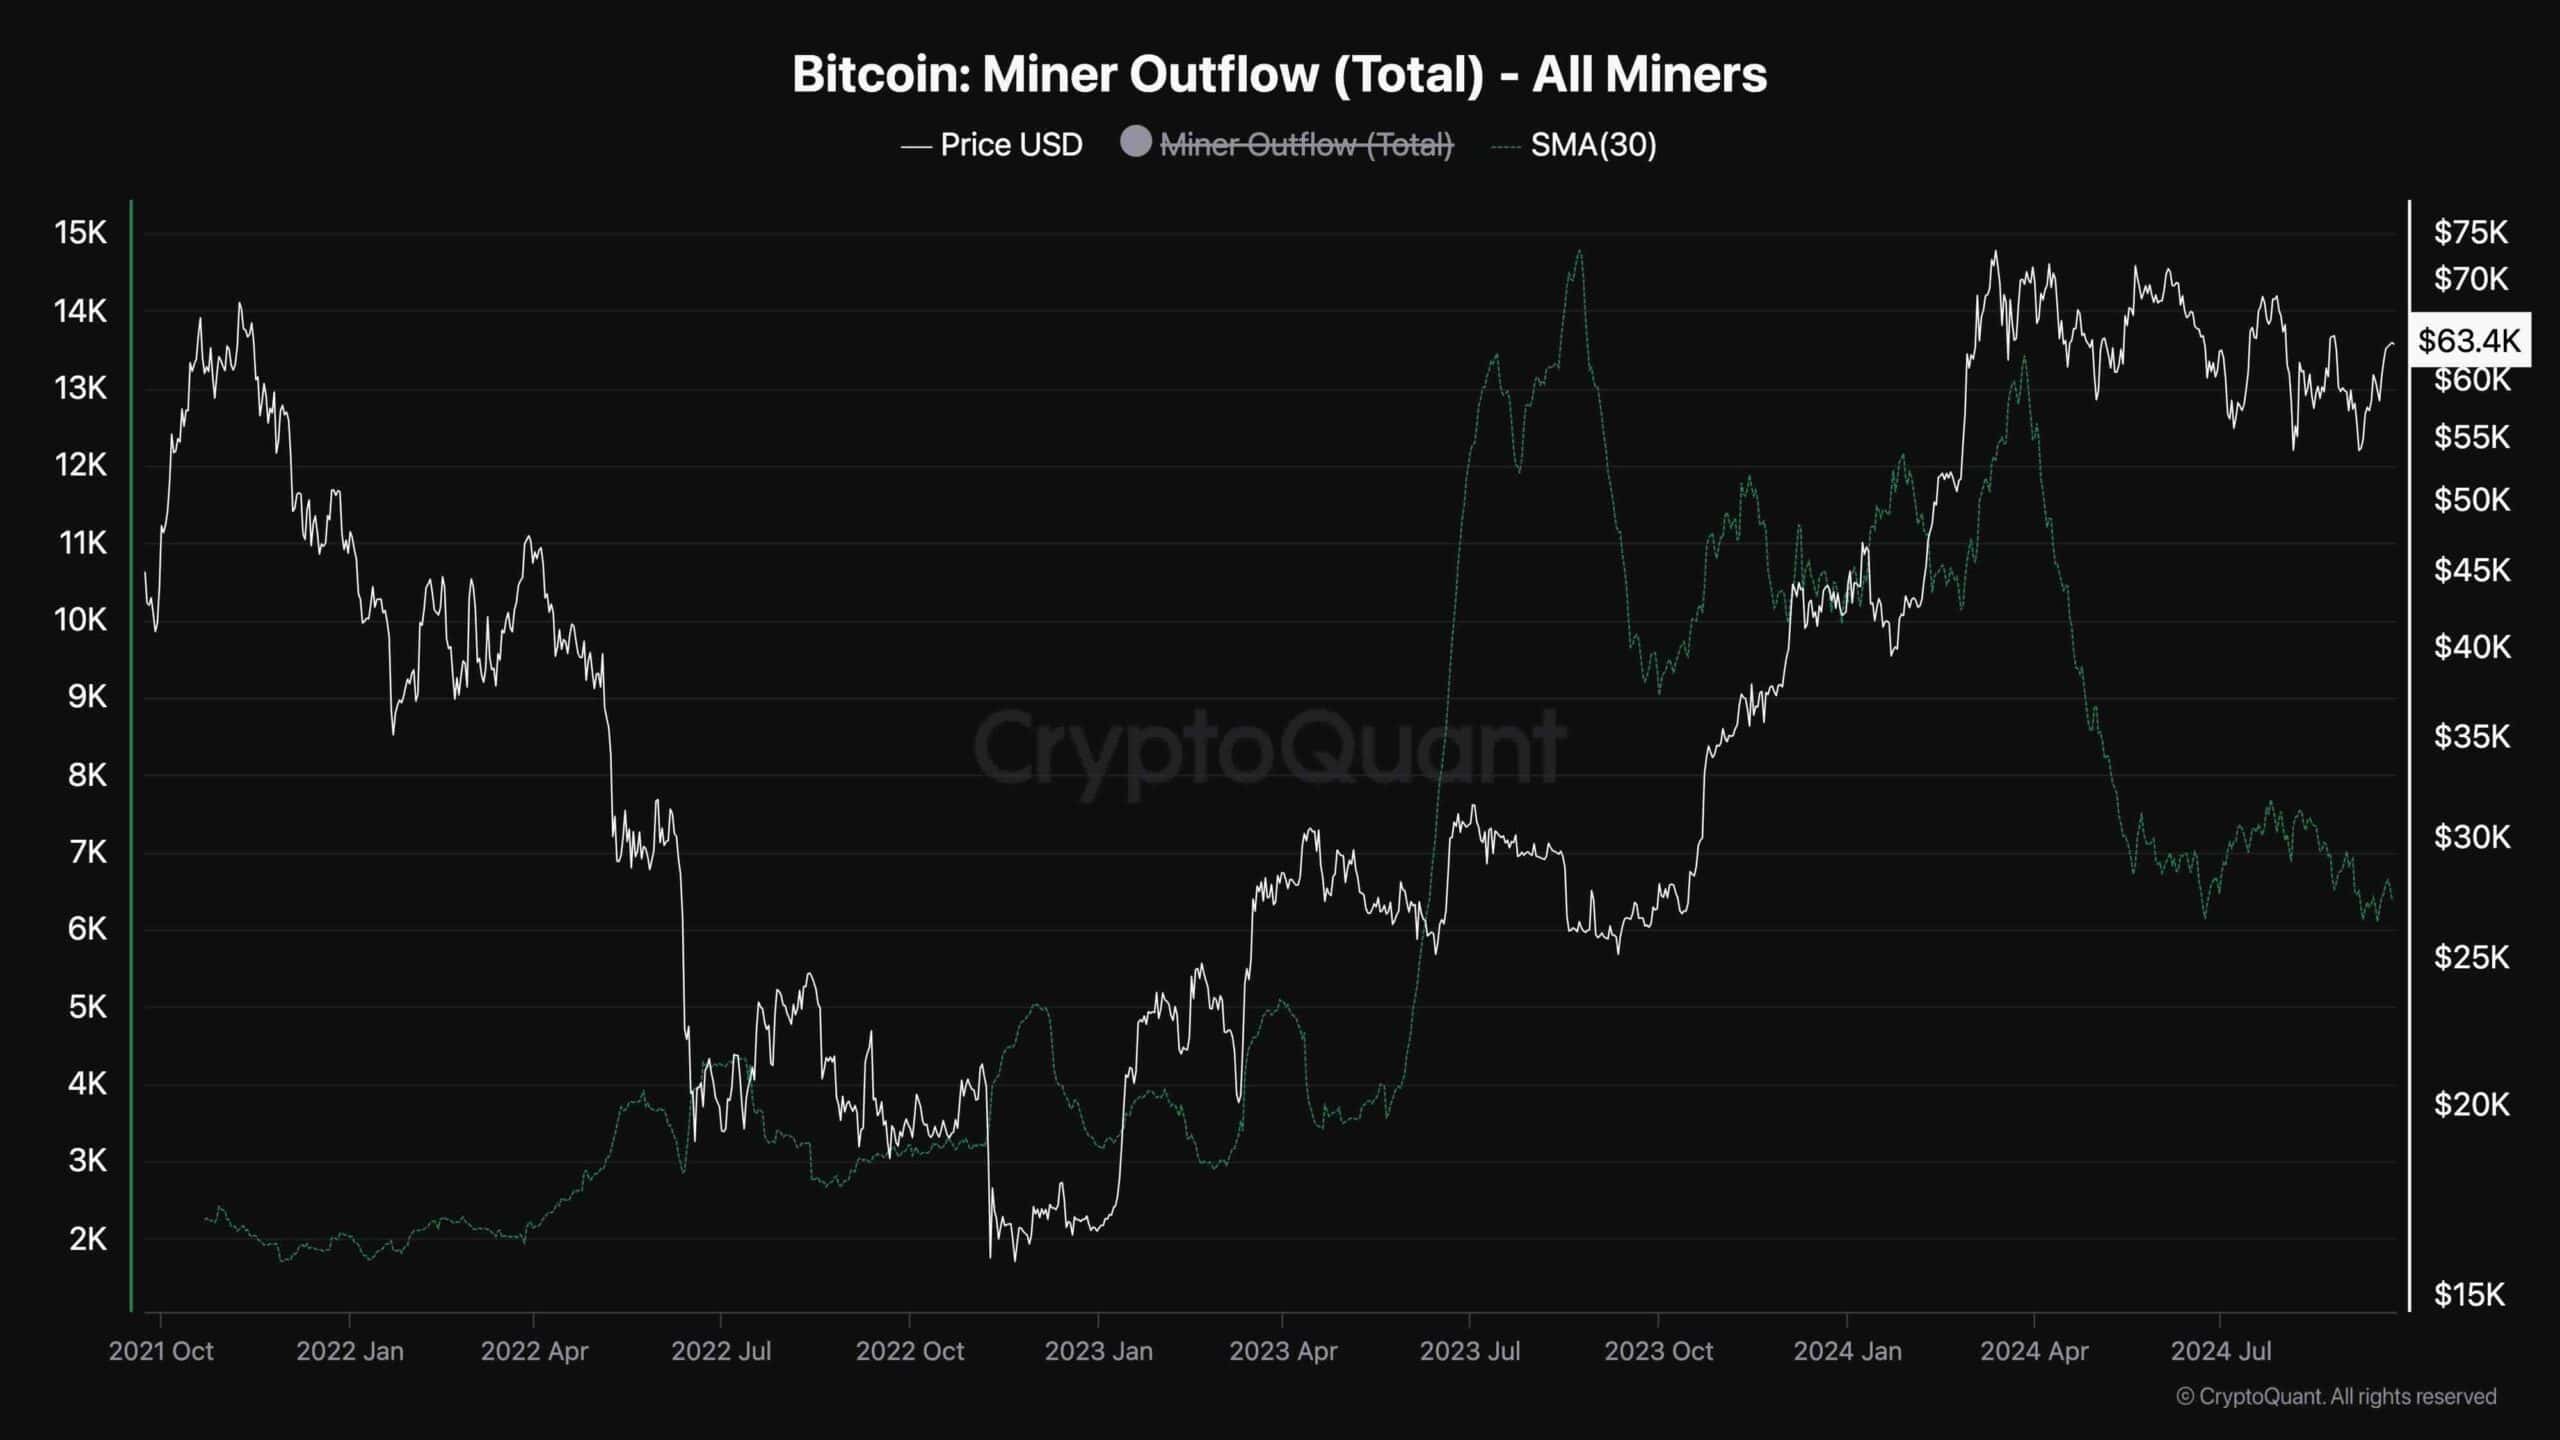
Bitcoin Miner Outflow (30-day moving average)
During Bitcoin’s price consolidation over recent months after creating a new all-time high, miners have changed their behavior significantly. This chart presents the 30-day moving average of the BTC miner outflow metric, which measures the amount of BTC exiting miners’ wallets.
As the chart suggests, they have reduced their selling pressure during this price consolidation. Therefore, it can be assumed that the miners are now ready to hold for higher prices, and this decrease in supply can eventually lead to a rally in the coming months.
The post Bitcoin Price Analysis: BTC Bull Run Incoming? Here’s the Next Critical Target appeared first on CryptoPotato.