Ripple has reclaimed significant resistance levels, surging above the $3 psychological threshold.
While the price exhibits strong bullish momentum, mixed signals in market indicators suggest a potential corrective phase may precede further upward movement.
XRP Analysis
By Shayan
The Daily Chart
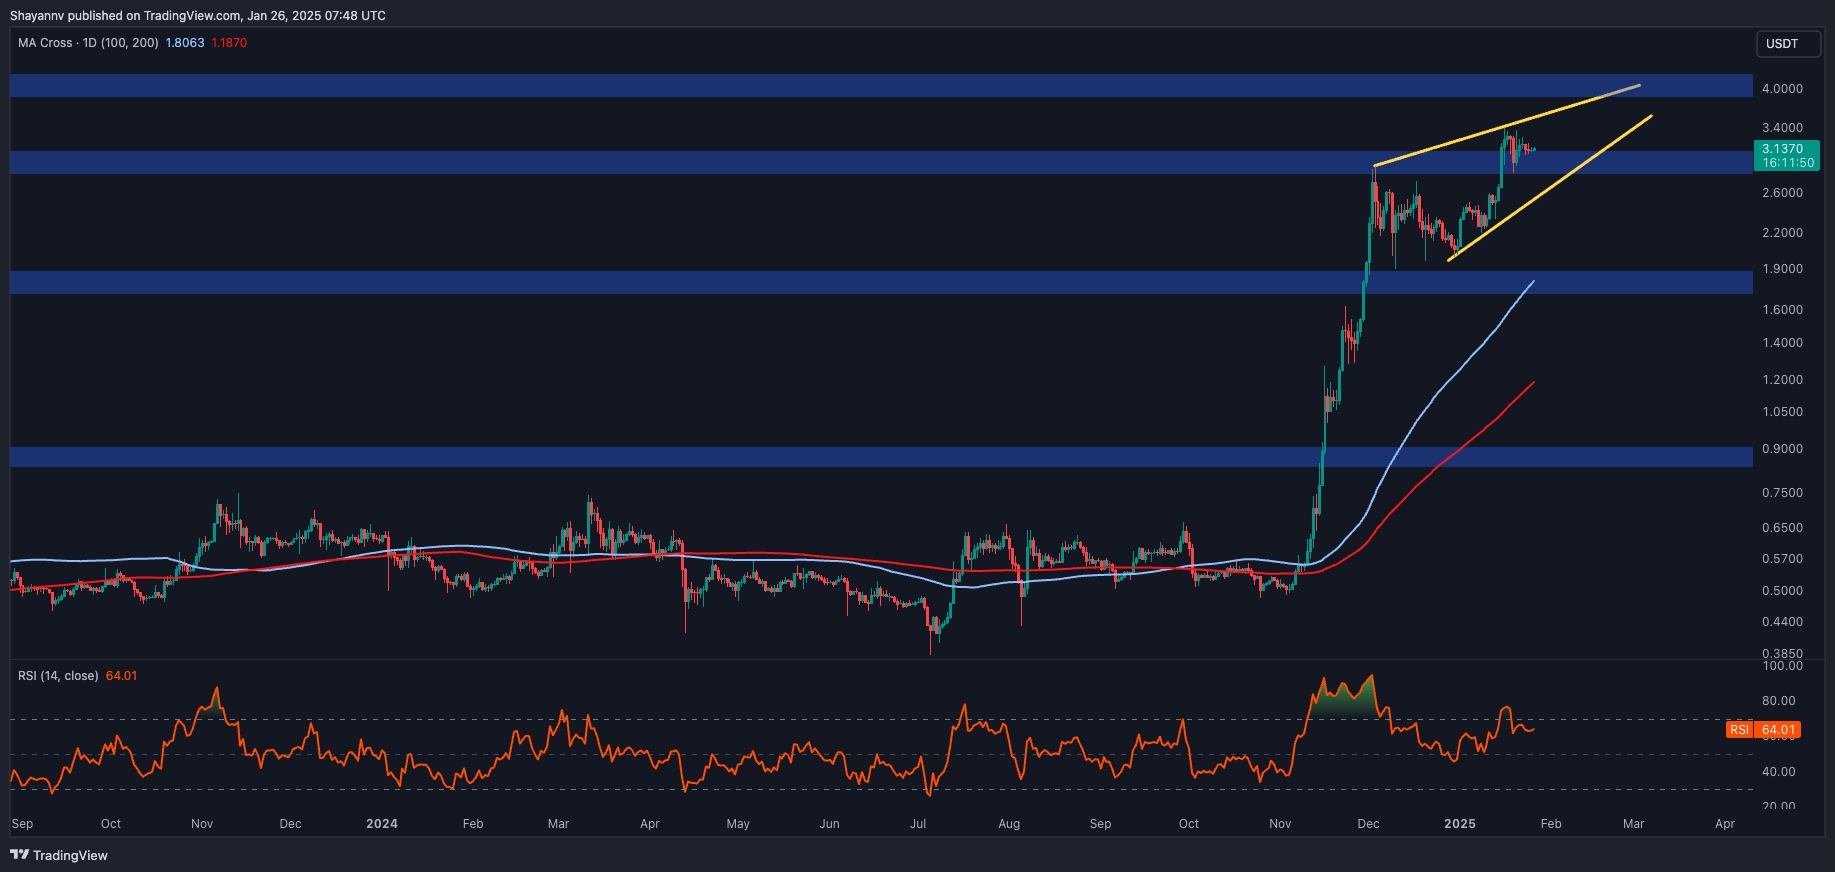
XRP has demonstrated impressive bullish momentum in recent months, breaking above key resistance zones, including its prior major swing high of $2.8 and the psychological $3 mark. This breakout highlights the dominance of buyers in the market, suggesting a robust bullish sentiment.
However, upon reaching the $3.4 price level, the bullish momentum encountered selling pressure, leading to a period of consolidation. The RSI indicator shows a bearish divergence alongside an overbought state, which implies a potential corrective phase could emerge soon.
Despite this, the price action remains within an ascending wedge pattern, suggesting that a continuation of upward consolidation is plausible in the mid-term, provided buyers maintain control.
The 4-Hour Chart
On the 4-hour chart, XRP’s breakout above $2.8 triggered a wave of short liquidations, driving the price toward the $3.4 region. This zone now acts as a significant resistance area characterized by heightened supply levels.
While temporary rejection and consolidation are likely at this resistance, Ripple’s strong bullish momentum hints at a potential breakout above the $3.4 mark in broader prospects. Such a move would pave the way for a new all-time high.
In the short term, heightened volatility should be expected, with potential corrections pulling the price back toward the 0.5-0.618 Fibonacci retracement levels. This range could provide a strong support zone, allowing Ripple to gather momentum for another rally.
The post Ripple Price Analysis: Is XRP Set to Break Out as Consolidation Wraps Up? appeared first on CryptoPotato.
