As one of the large-cap crypto assets with a lot of followers, Cardano has been one to watch during the recent bull market.
However, there might be much more upside for ADA in the coming months.
By Edris Derakhshi (TradingRage)
The USDT Paired Chart
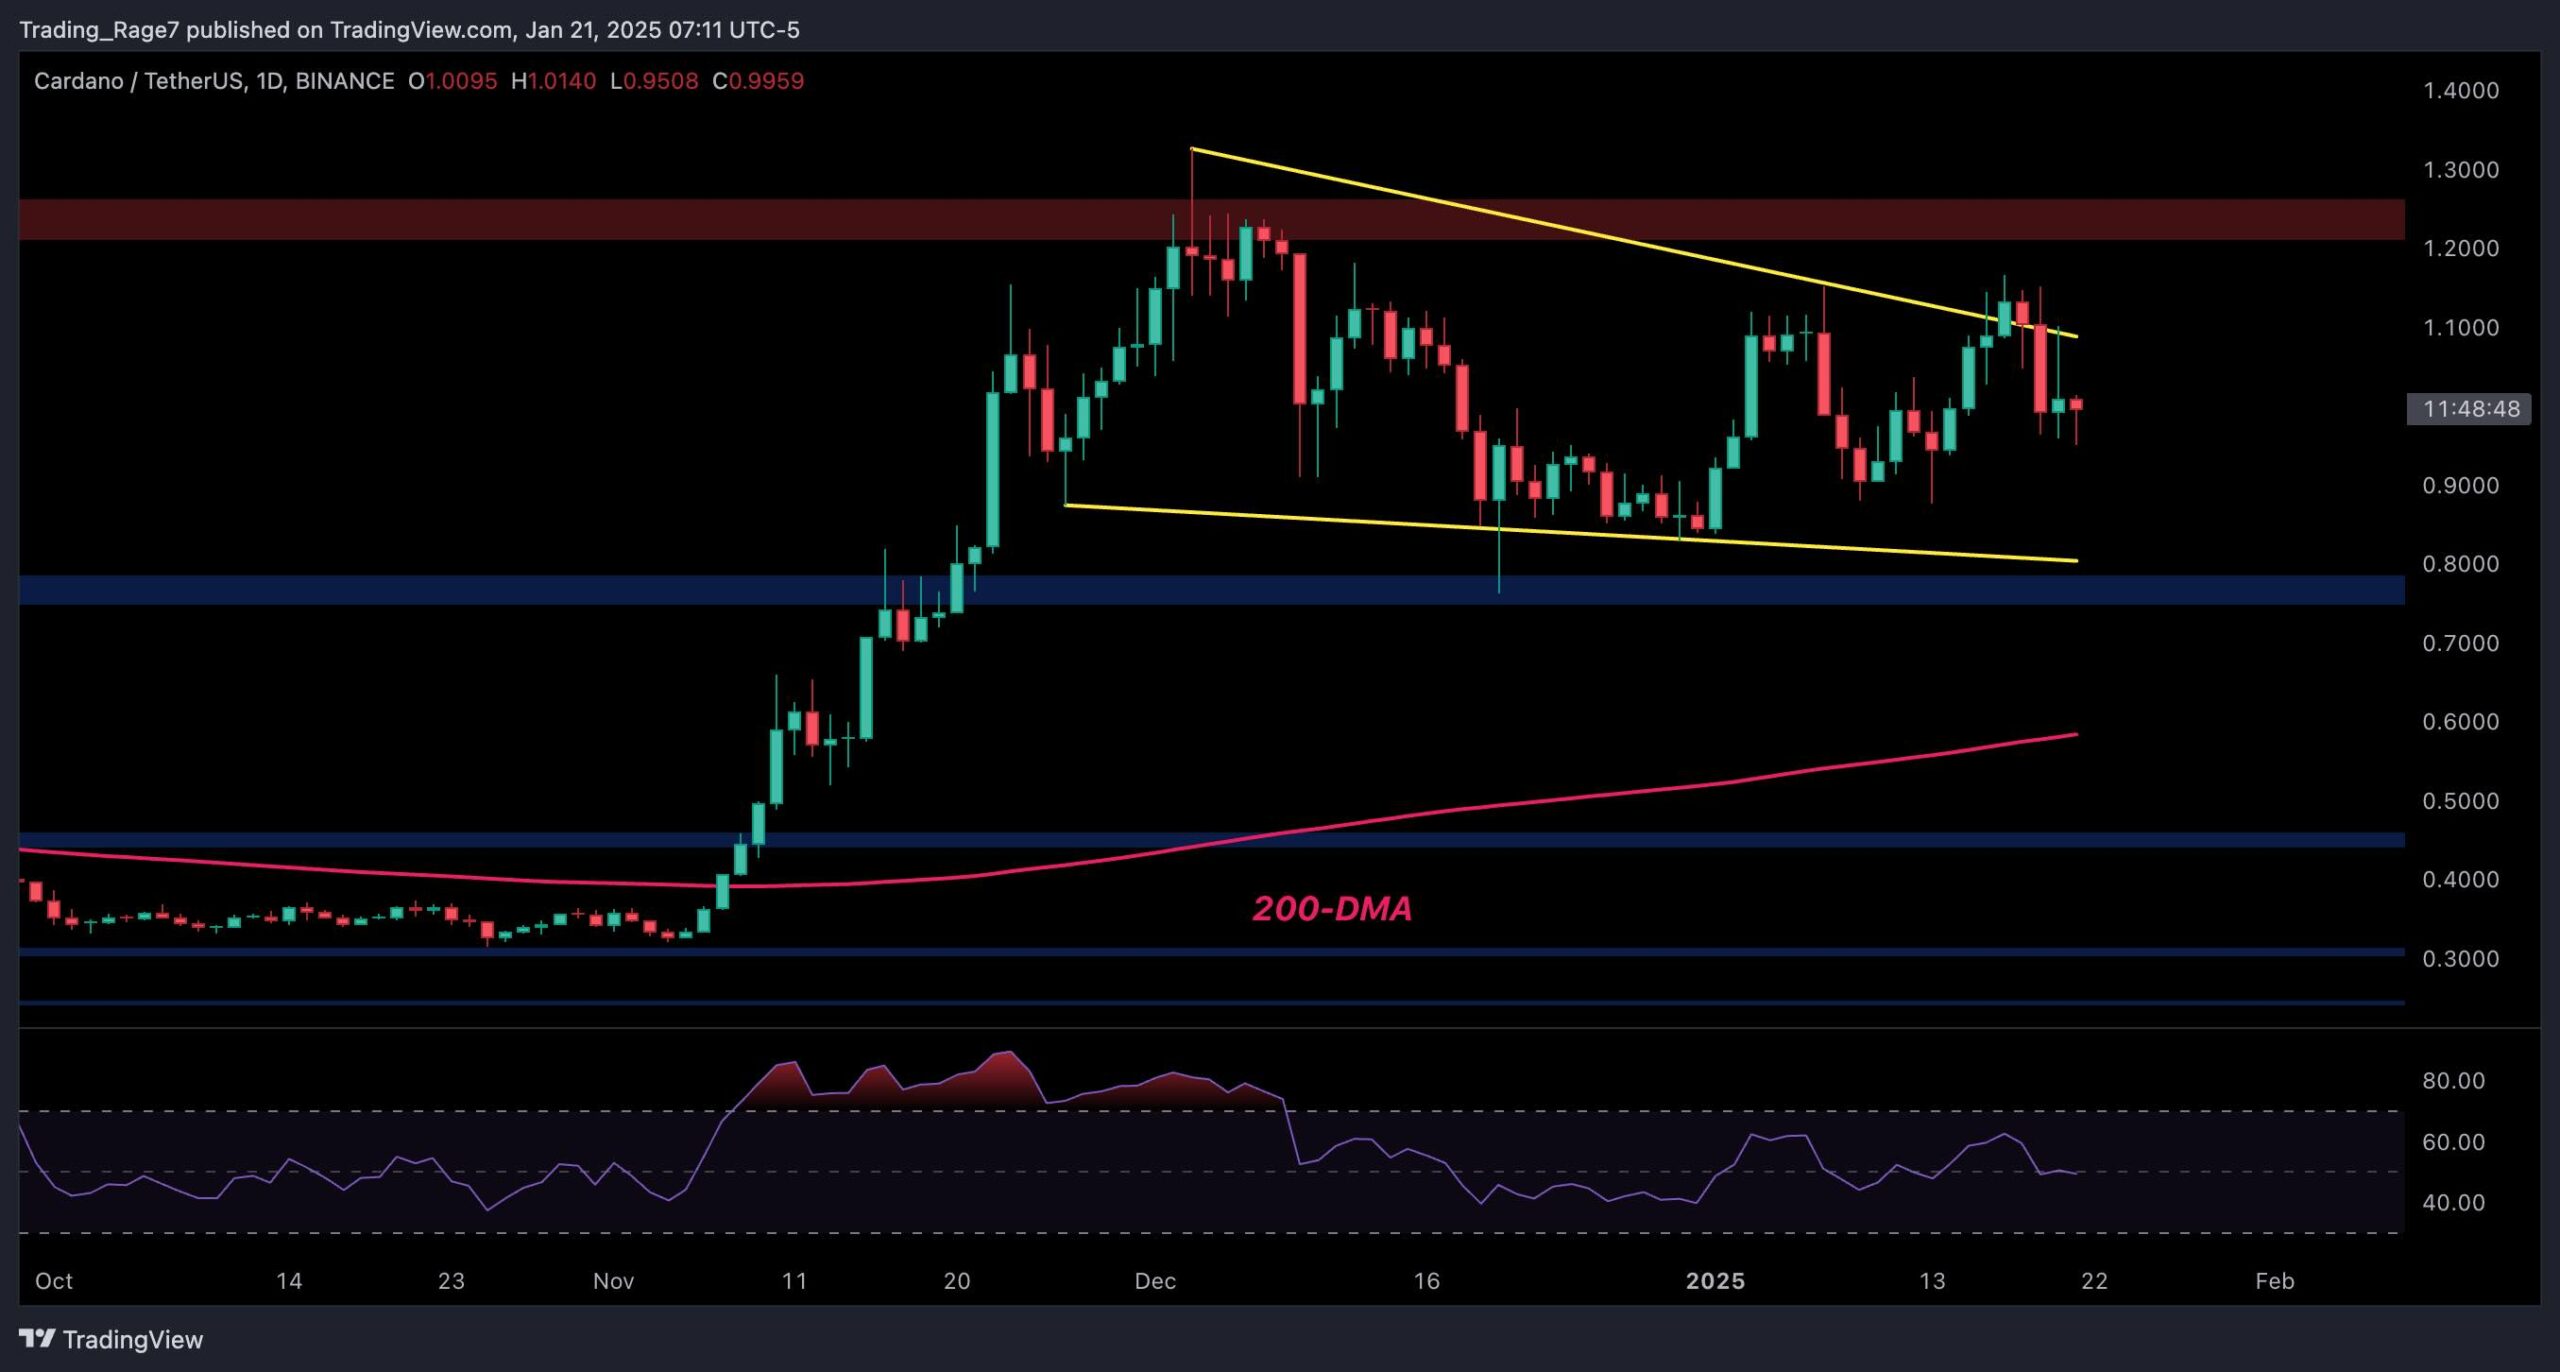
Cardano’s price has been consolidating inside a large falling wedge pattern on the USDT paired chart since it failed to break above the $1.2 resistance level in early December.
The market has been trying to rise higher in recent days but has failed to stay above the higher boundary of the pattern. Yet, as long as the $0.8 support level is intact, a bullish breakout and continuation could be expected.
The BTC Paired Chart
Looking at the ADA/BTC chart, the price has behaved similarly to that of ADA/USDT. Yet, during the last few days, ADA has been dropping against BTC and is currently testing the 900 SAT support level.
If this level is broken down to the downside, the 200-day moving average, located around the 750 SAT mark, could be the next target. In this case, Bitcoin will likely outperform Cardano in the coming weeks.
The post Cardano Price Analysis: ADA’s Bull Run Hinges on Holding This Key Support appeared first on CryptoPotato.
