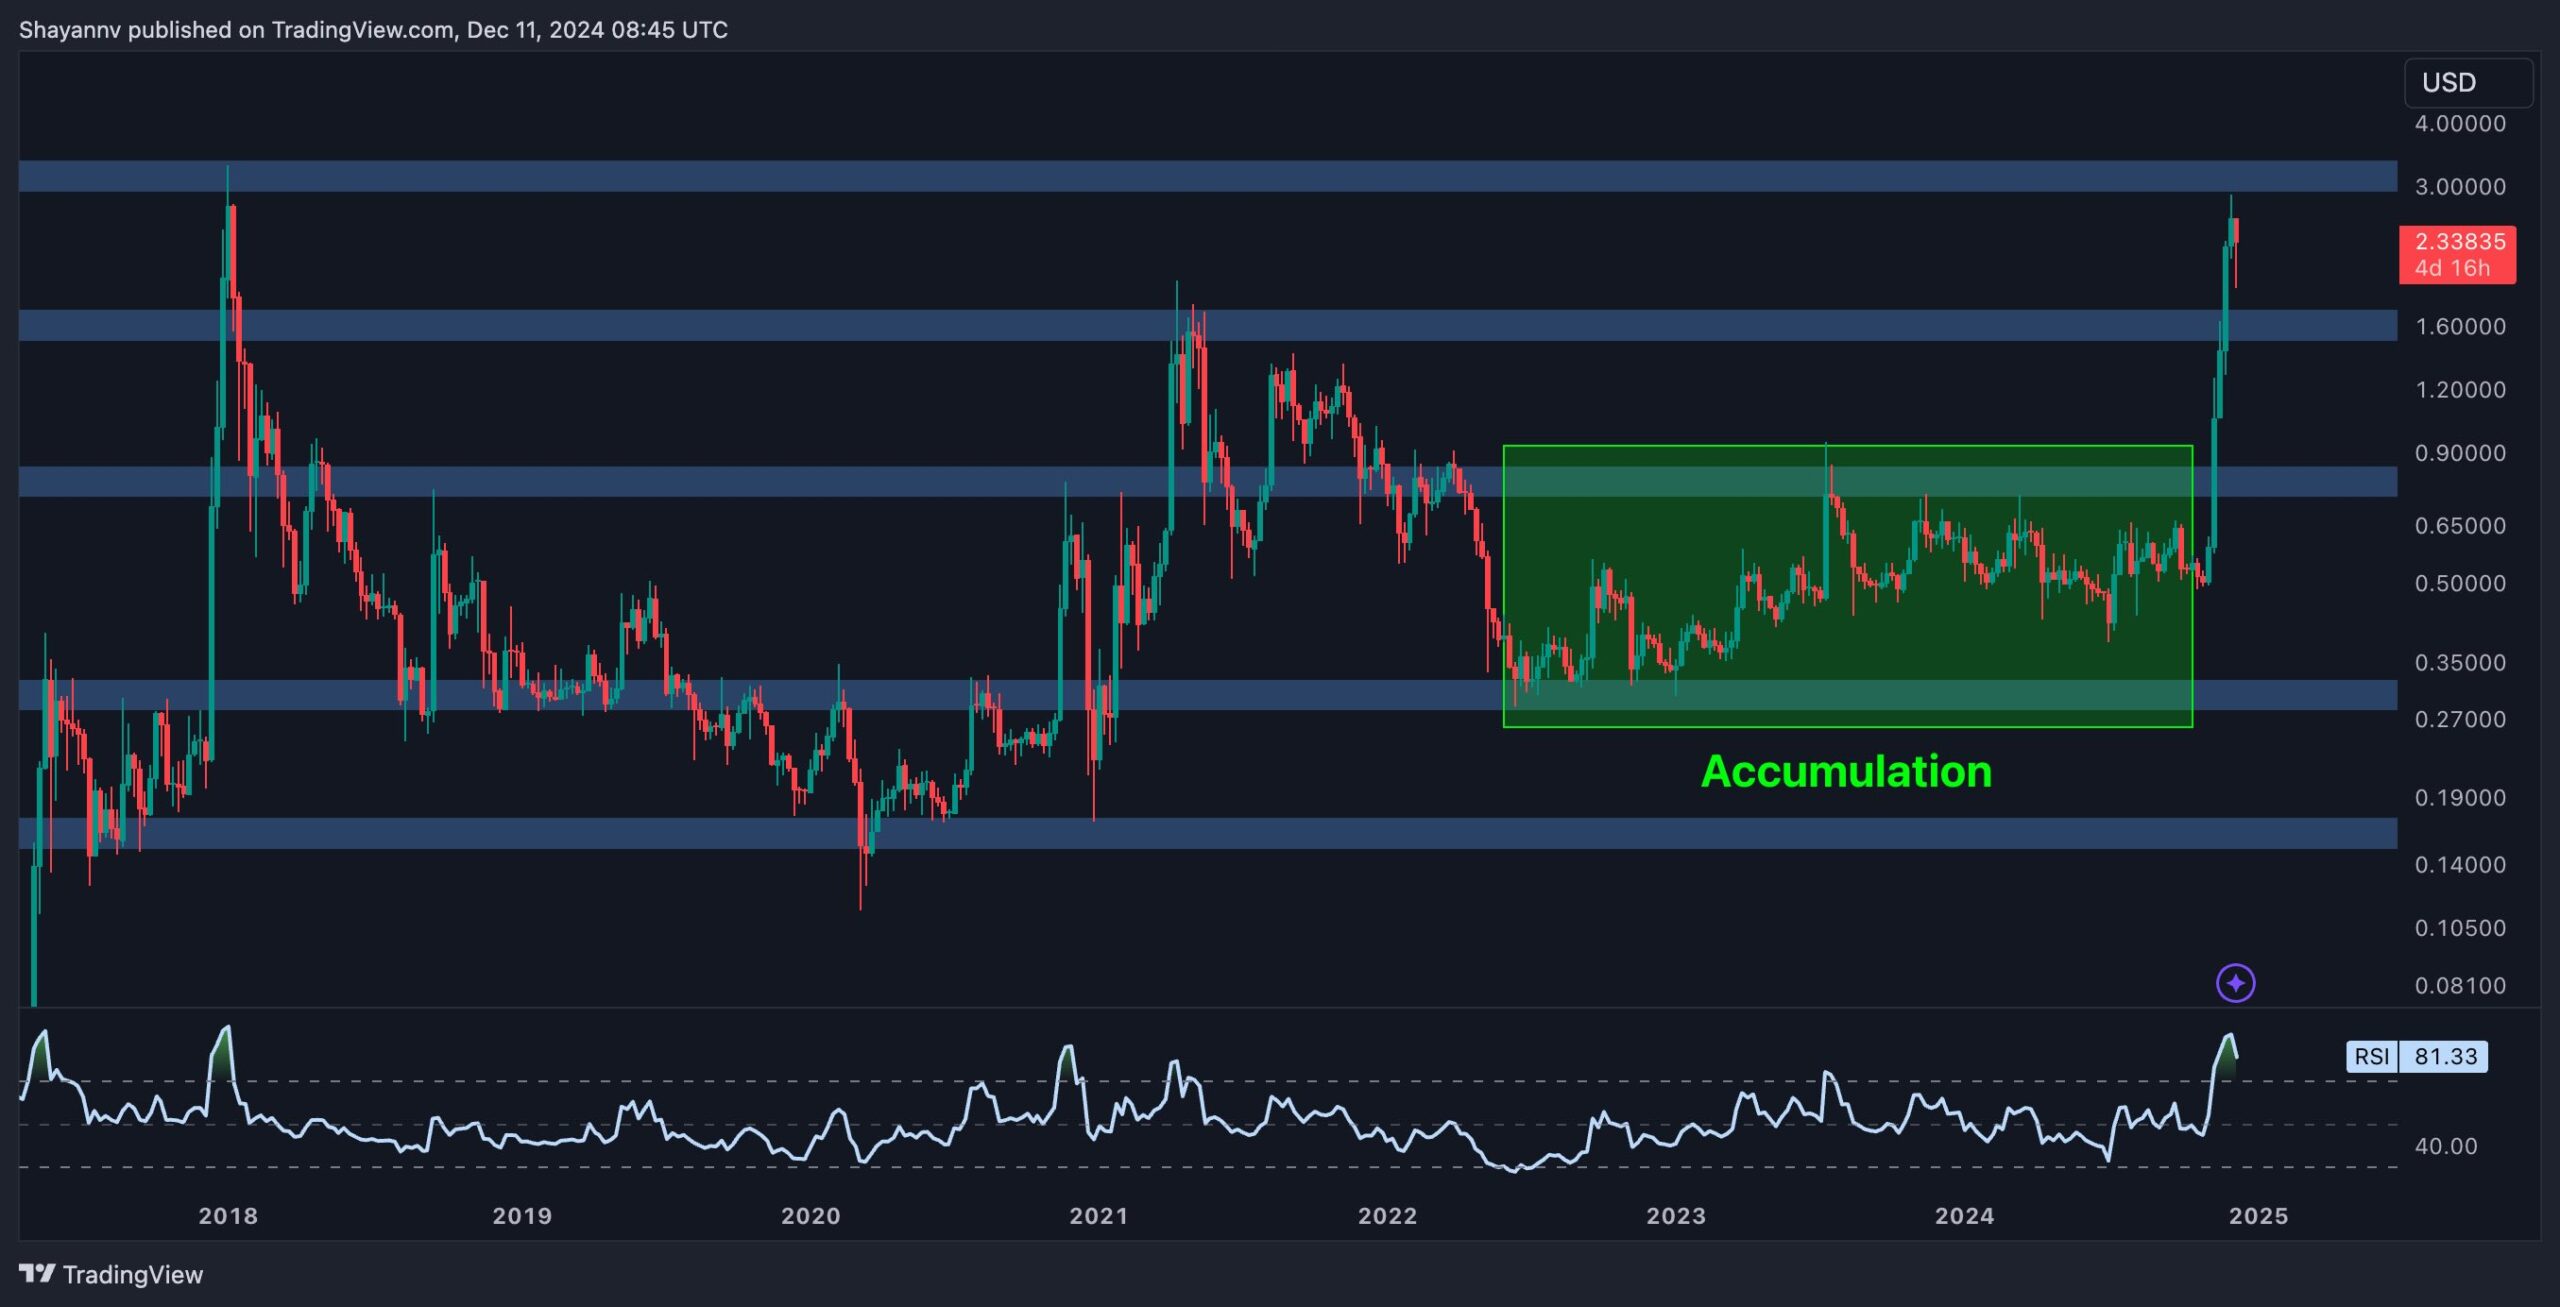
Ripple recently broke past its previous major swing high of $2, maintaining strong upward momentum and nearing its all-time high of $3.4.
This price zone is critical, as a breakout above it could ignite a substantial rally to unprecedented levels.
XRP Analysis
By Shayan
The Weekly Chart
After an extended accumulation phase within the $0.3–$0.9 range, Ripple witnessed intensified buying pressure, triggering a powerful surge. The price soared approximately 490% from the lowest levels, reclaiming multiple key resistance levels, including the pivotal $2 mark. However, XRP now faces a significant supply zone around $3, where selling pressure could hinder further advances.
Additionally, the RSI indicates overbought conditions, suggesting a likely consolidation phase within the $2–$3.4 range. This pause would allow the market to absorb selling pressure before buyers potentially mount a decisive attempt to break through this psychological resistance and set a new ATH.
The 4-Hour Chart
On the 4-hour timeframe, XRP encountered strong resistance at the $3 region, triggering notable selling activity and a price rejection. This pullback signals a temporary loss of bullish momentum, possibly reflecting profit-taking and distribution among market participants.
Following the rejection, Ripple entered a consolidation phase, breaking below its multi-week ascending trendline. This development suggests increasing dominance of sellers and a likely corrective phase in the near term. Market volatility and fluctuations could intensify, with the $2 level acting as a critical support zone.
After this consolidation period, Ripple is expected to regain bullish traction, with another attempt to breach the $3 resistance likely on the horizon.
The post Ripple Price Analysis: Where Is XRP Headed Following Massive Crash and Swift Rebound? appeared first on CryptoPotato.
