
The moving average that speeds up when markets trend and slows down when they chop. Here’s how it works, how to read it, and where it fails.
KAMA Indicator Explained — How It Works & When to Use It
Every trader has lived this moment. You’re running a 20-period moving average. Bitcoin rips 8% in a morning, and your average is still crawling upward, telling you nothing new. So you shorten it to 8 periods. Now the market chops sideways for two weeks, and your fast average whips back and forth through price like a metronome, handing you five losing signals in a row.
Fixed-length moving averages force a trade-off: fast means noisy, slow means late. You can’t have both.
Perry Kaufman looked at that problem and asked a better question: what if the average itself could decide how fast to be? The result is Kaufman’s Adaptive Moving Average (KAMA), an indicator that measures how efficiently price is moving and adjusts its own responsiveness in real time.
In this guide, you’ll learn exactly how KAMA works, how the efficiency ratio drives it, how to interpret trends with it, how it behaves in ranging versus trending markets, and, just as important, where it produces false signals. Whether you trade crypto, stocks, or build algorithms, you’ll leave with something you can test today.
What Is Kaufman’s Adaptive Moving Average (KAMA)?
KAMA is an adaptive moving average introduced by Perry J. Kaufman in his 1995 book Smarter Trading. Unlike a simple moving average (SMA) or exponential moving average (EMA), which apply the same smoothing no matter what the market is doing, KAMA changes its smoothing speed bar by bar.
The logic is intuitive:
When price moves cleanly in one direction, the market is efficient. KAMA tightens up and follows price closely, reducing lag.When price moves erratically without going anywhere, the market is noisy. KAMA flattens out and mostly ignores the movement, reducing whipsaws.
Think of it as a moving average with a built-in noise filter. It doesn’t predict anything. It simply adapts its sensitivity to current conditions, which makes it one of the more popular adaptive indicators among technical analysts and systematic traders.
The Problem with Traditional Moving Averages
Before diving into the mechanics, it helps to understand what KAMA is trying to fix.
The SMA weighs every observation equally, which makes it smooth but slow. When a trend begins, the oldest data in the window drags the line behind price.
The EMA weights recent prices more heavily, which cuts lag. But its smoothing constant is fixed. A 10-period EMA always uses the same weight whether price is in a clean breakout or a messy, directionless range.
That fixed behavior creates two predictable failure modes:
Lag during fast moves: Entries come late, and exits come after a good portion of the profit is gone.Over-reaction to noise: Shorter averages cross price constantly in sideways markets, generating a stream of small losses.
Most traders manage this by switching settings or stacking filters. KAMA builds the solution directly into the formula.
The Efficiency Ratio: The Engine Behind KAMA
The heart of KAMA is the efficiency ratio (ER). It answers a simple question: how much of the price movement over the last N bars was actual progress, and how much was wasted motion?
The formula:
ER = |Close today − Close N periods ago| ÷ Sum of |Close − Previous close| over N periodsThe numerator is net change: how far price traveled from start to finish.The denominator is volatility: the total distance price covered along the way, including every up and down tick.
ER always falls between 0 and 1.
ER near 1.0: price moved in a nearly straight line. Almost all movement was directional.ER near 0: price moved a lot but ended up roughly where it started. Almost all movement was noise.
A Quick Numeric Example
Imagine a 10-bar window.
Trending scenario: Price rises exactly $1 each bar, from $100 to $110. Net change is $10. Total path traveled is also $10. ER = 10 ÷ 10 = 1.0.
Choppy scenario: Price swings up $2, down $2, and repeats, finishing just $1 above where it started. Net change is $1, but total path traveled is $20. ER = 1 ÷ 20 = 0.05.
Same number of bars, wildly different character. The efficiency ratio captures that difference in a single number, and KAMA uses it to decide how much weight the newest price deserves.
How the KAMA Smoothing Mechanism Works
Once you have the efficiency ratio, KAMA converts it into a smoothing constant (SC) that sits between a fast limit and a slow limit.
The standard Kaufman settings are:
ER period: 10Fast period: 2 (fast constant = 2 ÷ (2 + 1) = 0.6667)Slow period: 30 (slow constant = 2 ÷ (30 + 1) = 0.0645)
The smoothing constant is calculated as:
SC = [ER × (fast − slow) + slow]²
Then KAMA updates like an EMA, using that dynamic constant:
KAMA = Previous KAMA + SC × (Price − Previous KAMA)
Squaring the term is the clever part. It pushes the smoothing constant toward the slow end unless efficiency is genuinely high, so KAMA stays calm during noise and only accelerates when the market commits.
Plug in our two scenarios:
Trending (ER = 1.0): SC = (0.6667)² ≈ 0.444. KAMA moves about 44% of the distance toward price each bar. It hugs the trend.Choppy (ER = 0.05): SC = (0.05 × 0.6022 + 0.0645)² ≈ 0.009. KAMA moves less than 1% of the distance toward price. It’s nearly flat.
For comparison, a standard 10-period EMA uses a constant smoothing factor of roughly 0.18 at all times. KAMA’s effective speed swings from about 0.009 to 0.444, a range of nearly 50 to 1. That’s the adaptivity in action.
How to Interpret KAMA in a Trend
KAMA is read much like other moving averages, with a few adaptive twists.
1. Direction and slope: A rising KAMA suggests an uptrend, and a falling KAMA suggests a downtrend. Because KAMA flattens in noise, a flat KAMA is itself informative: it signals that the market lacks directional conviction.
2. Price relative to KAMA: Price closing above a rising KAMA supports a bullish bias. Price closing below a falling KAMA supports a bearish one. Many traders treat KAMA as dynamic support in uptrends and dynamic resistance in downtrends.
3. Crossovers: The most common signal is price crossing KAMA. A close above KAMA may mark a bullish shift, while a close below may mark a bearish one. Crossovers happen less often than with a fast EMA, which is the point.
4. Two-KAMA systems: Some traders run a fast KAMA (for example, ER period 5) against a slower one (ER period 20 or 30) and trade the crossover, similar to a classic dual moving average system but with adaptive smoothing.
5. Slope filters: A popular refinement measures the change in KAMA over several bars, or compares it to a volatility measure like ATR, and ignores crossovers when the slope is too small. This directly targets chop.
KAMA in Trending vs. Ranging Markets
The indicator’s personality changes depending on conditions. Understanding both is what separates informed use from blind use.
Trending Markets
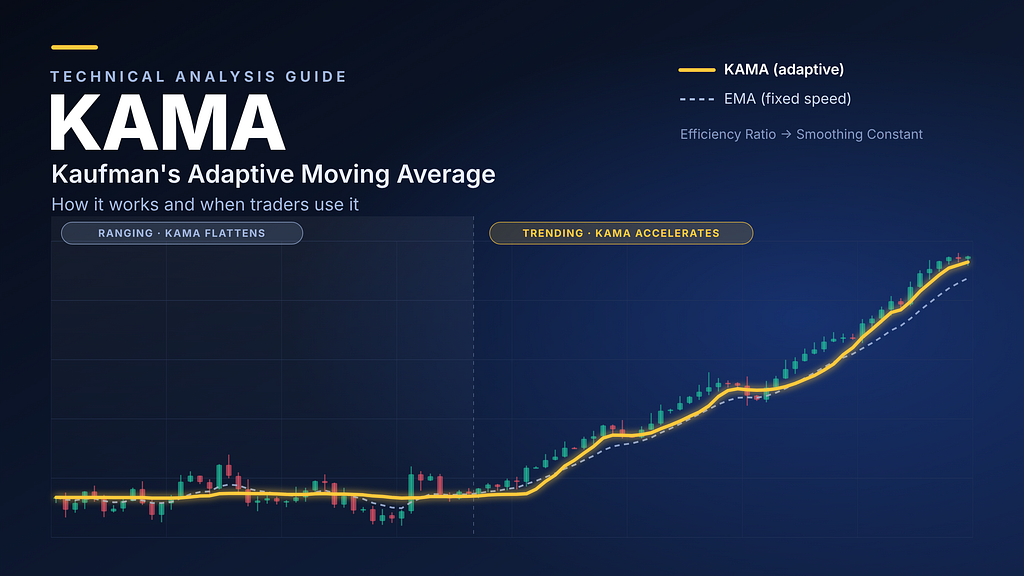
Picture a strong crypto rally, say Ethereum climbing steadily over several weeks with shallow pullbacks. Directional movement dominates, so the efficiency ratio stays elevated. KAMA accelerates, tracks price tightly, and lets traders stay in the move without being shaken out by every minor dip.
Compared to a 30-period SMA, KAMA typically turns up earlier at the start of the trend and sits closer to price throughout it. Compared to a 10-period EMA, it’s less likely to be pierced by routine pullbacks.
The same applies to equities. A stock breaking out after earnings and grinding higher with consistent buying is the textbook environment for adaptive averages.
Ranging Markets
Now picture the same asset stuck between two price levels for three weeks, bouncing between support and resistance. Net movement is small, total movement is large, and the efficiency ratio collapses toward zero.
KAMA responds by going nearly flat. Price weaves above and below it, but the average barely moves. A fast EMA in the same conditions would snake around price and fire repeated false crossovers.
That flat KAMA line is useful information. It tells you the trend-following playbook is probably the wrong tool right now. Some traders use a flat KAMA as an explicit “stand aside” condition, or as a cue to switch to mean-reversion tactics.
The Catch: KAMA and False Signals
Here’s where most articles stop at the sales pitch. KAMA is not magic, and it has real weaknesses worth knowing before you put capital behind it.
False signals at the edge of regime changes: KAMA adapts based on recent efficiency. When a quiet range suddenly breaks, KAMA is still in slow mode. The first bars of the breakout may produce a late signal, because the ER hasn’t yet risen enough to speed the average up.
Fakeouts in the transition zone: In a range that’s gradually turning into a trend (or vice versa), ER hovers at mid-levels. KAMA runs at a middling speed and can generate crossovers that don’t follow through.
Single-bar efficiency spikes: A large news-driven candle can lift the ER abruptly, causing KAMA to lurch toward price and then snap back. Crypto’s overnight volatility and equity earnings gaps both trigger this.
Parameter sensitivity: The default 10/2/30 settings were designed with specific market behavior in mind. Intraday crypto on a 15-minute chart is a different animal than daily stock data. Overfitting parameters to past data is the fastest way to build a system that looks brilliant in backtests and fails live.
It’s still a lagging indicator: Adaptive doesn’t mean predictive. KAMA reacts to what has already happened, just more intelligently than most averages.
Some ways to reduce false signals:
Require confirmation: Wait for a close beyond KAMA, not just an intrabar touch.Add a slope or ER threshold: Only act when ER exceeds, say, 0.3 or when KAMA’s slope exceeds a minimum.Combine with volume or momentum: RSI, MACD, or volume expansion can confirm that a crossover has real participation behind it.Use higher-timeframe context: Trade KAMA signals in the direction of the higher-timeframe trend.Size positions modestly: No filter eliminates losing trades. Risk management does the real work.
Building KAMA Into a Trading System
For algorithmic trading enthusiasts, KAMA is attractive because it’s simple to code, has few parameters, and behaves sensibly across markets. A basic framework looks like this:
Entry logic
Long when price closes above KAMA and KAMA’s slope is positive over the last N bars.Short (or stay flat) when price closes below KAMA and the slope is negative.
Filter logic
Skip trades when ER falls below a threshold, which keeps the system out of chop.Optionally require a higher-timeframe KAMA to agree with direction.
Exit logic
Exit on an opposite close through KAMA, or use a trailing stop based on ATR.
Risk logic
Fixed fractional position sizing, with a hard maximum loss per trade.
When you backtest, do it properly: use out-of-sample data, include trading fees and slippage (which matter a great deal in crypto), and test across different market regimes, not just the bull run that flatters every trend strategy. If a KAMA system only works with one precise parameter set, that’s a warning sign, not a discovery.
KAMA also works well as a component rather than a standalone strategy. Many systematic traders use it as a regime filter that decides which strategy to run, or as the trend leg inside a multi-signal model.
Where Automation Fits In
Once you’ve defined rules like these, the hard part usually isn’t the indicator. It’s executing consistently, without hesitation, across multiple assets, around the clock. Crypto never closes, and manually watching KAMA crossovers on several charts is exhausting.
That’s the gap automation is meant to fill. Hyperlyx AI is an AI investment assistant built to help traders and investors run crypto and stock strategies on automation, spread exposure across assets, and keep a portfolio more diversified.
One detail stands out given how much concern there’s been recently about AI agents and account security: Hyperlyx AI acts independently and does not require you to connect your wallets or bank accounts. For anyone cautious about handing an AI tool the keys to their funds, that’s a meaningful difference in how it’s designed.
If you’re already thinking in terms of rules, filters, and risk limits, it’s worth looking at how Hyperlyx AI approaches automated trading and exposure management. As always, do your own research, start small, and test any automated approach before scaling it.
Key Insights: When Do Traders Use KAMA?
To summarize the essentials:
KAMA adapts its speed using the efficiency ratio, which compares net price change to total price movement.High efficiency makes KAMA fast; low efficiency makes it slow, flattening it during noise.It’s best suited to trend-following and works as a regime filter that tells you when not to trade.It still lags and still fails at regime transitions and during sudden volatility spikes.Confirmation, filters, and risk management matter more than the indicator itself.
Frequently Asked Questions About KAMA
What does KAMA stand for?
KAMA stands for Kaufman’s Adaptive Moving Average, an adaptive trend indicator developed by Perry Kaufman.
What are the default KAMA settings?
The standard settings are an efficiency ratio period of 10, a fast period of 2, and a slow period of 30.
Is KAMA better than the EMA?
Not universally. KAMA reduces whipsaws in sideways markets and lag in strong trends, but it adds complexity and can still produce false signals. The better choice depends on your market, timeframe, and strategy.
Does KAMA work for crypto trading?
Many traders apply it to crypto because of the market’s mix of sharp trends and noisy consolidation. Parameters usually need adjusting for the timeframe, and fees and slippage should be included in any backtest.
Can KAMA predict price?
No. KAMA is a lagging, trend-following indicator. It describes conditions; it doesn’t forecast them.
What is the efficiency ratio in KAMA?
It’s a value between 0 and 1 that measures how directional price movement has been over a set number of periods. A value near 1 means a clean trend, and a value near 0 means noise.
Final Thoughts
KAMA won’t make you a profitable trader on its own. No indicator will. What it does offer is a smarter answer to a very old problem: how to follow trends without getting chopped up by noise. By letting market efficiency set its speed, it removes one of the biggest compromises in moving average design.
Test it on your own charts. Compare it against the EMA you currently use. Pay attention to the flat stretches as much as the crossovers, because that’s often where KAMA tells you the most.
If this article saved you time or sharpened your thinking, please give it a clap, follow for more technical analysis and algo trading breakdowns, and repost it. Someone in your network is probably still wrestling with lagging averages and whipsaw losses, and this might be exactly the explanation they’ve been searching for.
Kaufman’s Adaptive Moving Average (KAMA): How It Works and When Traders Use It was originally published in Coinmonks on Medium, where people are continuing the conversation by highlighting and responding to this story.