
On futures and listed options, a systematic strategy pays three times, and twice before its first trade. First for data: order book history, exchange licenses, vendor subscriptions. Then for access: a brokerage account, margin, options approval and, if you want to compete on speed, colocation. And finally for the instrument itself, on every trade: dealers price the volatility in options, and the spread reflects who is on the other side.
That does not mean traditional markets are broken. They are deep, regulated and tested over decades, and for most capital they remain the default choice. But the cost structure has long decided for traders who gets to do systematic research and who does not.
Prediction markets offer different terms. Contracts are fully collateralized and pay $1 or $0, the order book is public, and the loss on every position is capped in advance. There is an obvious catch: liquidity. We cover it in as much detail as everything else.
This article compares the two worlds on the axes that matter to a systematic trader: entry barrier, leverage and gap risk, the price of optionality, data, equal access, strategy expected value and capacity. The conclusion is at the end, and it does not point only one way.
One view, three instruments
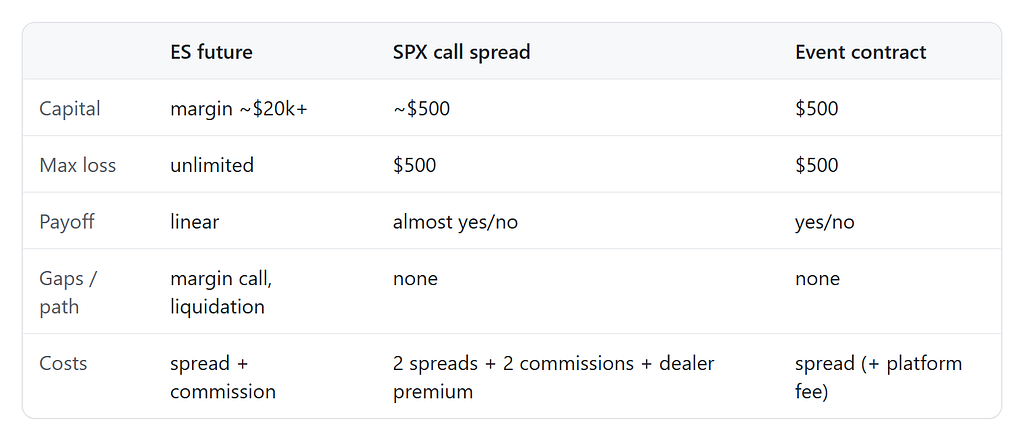
Take a simple view: “the S&P 500 will close the day above 6000”. Say the index is at exactly 6000 and we put the odds at roughly 50/50. There are three ways to express this view.
Futures. We buy one E-mini S&P 500 (ES). The multiplier is $50 per point, the notional is about $300,000, and initial margin is around $20,000 or more (CME revises it regularly). The payoff is linear: +10 points is +$500, a gap of −100 points is −$5,000. There is no cap on the loss. In effect we are betting not only on direction but also on the size of the move and on the path: if a margin call comes along the way, the position can be lost before the close, even if the view turns out right.
Options. A single 6000 call does not fit: its payoff grows without a cap (a close at 6010 pays $1,000, at 6100 it pays $10,000), so it is again a bet on the size of the move, and it is expensive because we pay for all that potential upside. So the position is built from two options: buy the 6000 call and sell the 6010 call on SPX (multiplier $100). The short call cuts off everything above 6010: the payoff tops out at $1,000, and the premium from selling it brings the cost down to about $500. The result is almost a yes/no: below 6000 it pays 0, above 6010 it pays $1,000.
Almost, but not exactly. Between 6000 and 6010 the spread pays partially: a close at 6005 gives $500, not $1,000 or 0. There are two options, and on each we pay the bid-ask spread and a commission. Finally, most brokers require separate options approval for spreads (a questionnaire on experience, income and goals; in the US the broker must approve an account for options, and spreads usually unlock at level 2 or 3 out of 4 or 5) and, as a rule, a margin account.
Event contract. We buy “Yes” at $0.50, and the contract pays $1 if the view comes true. 1,000 contracts cost $500, the maximum gain is $1,000 and the maximum loss is $500, known at the moment of entry. No margin, no margin calls, no path dependence: all that matters is where the price ends up at the close.
For the systematic trader. The future expresses more than our view, the options express almost exactly our view but at a high price, and the event contract expresses exactly our view. The flip side is how large a position you can build in it. We come back to this in the section on liquidity.
Entry barrier and frozen capital
To trade futures and options you need a broker, and with it onboarding: KYC, a questionnaire on experience and income, options approval at the right level, a margin account. Since 2001, intraday trading of stocks and options in a US margin account fell under the pattern day trader rule: at least $25,000 in the account if you make 4 or more day trades in 5 days. In 2026 the rule was abolished, but brokers have until October 2027 to move to the new rules, and they set intraday margin themselves. Futures have no separate threshold, but margin on a single ES is tens of thousands of dollars, and capital for a strategy across several instruments with room for drawdowns runs into the hundreds of thousands.
The second problem is less visible: the money in your account is not fully yours, because the terms can change while you are in a position.
Margin goes up mid-position. Exchanges raise requirements in volatile markets (in March 2020 CME raised margins so often that on some contracts they nearly doubled in less than a month), and brokers can add their own house margin on top without notice. A position that was fine in the morning needs more cash by lunch, or it gets closed out.Trading gets restricted. In January 2021 brokers blocked buying of GameStop and a number of other stocks after the clearinghouse raised collateral requirements (SEC report). Only selling was allowed.Access gets cut off for political reasons. In 2022 Interactive Brokers and other Western brokers restricted trading for clients from Russia and then started closing their accounts. You still have the position, but you are no longer the one who decides what happens to it.Trades get cancelled. In March 2022, after the nickel spike, the LME cancelled $3.9 billion of trades after the fact. Those who were right about the market were left without their profit.The market gets halted. When the index falls 7%, all stock trading stops for 15 minutes (in March 2020 this happened four times in two weeks), and individual stocks and futures halt when the price moves out of its band too fast. While trading is halted you cannot close a position, and after the pause the price often opens with a gap past your stop.“The reason for that was to take the market back to the last position where it was orderly.”Matthew Chamberlain, LME CEO, on cancelling the nickel tradesFor the systematic trader. None of these risks can be modeled from historical prices: they are absent from the backtest, and in reality they fire exactly in the tails.
In a prediction market the setup is simpler. The contract is fully collateralized at purchase: you paid $0.50, and that is your entire risk. Nobody raises the margin after the fact, and there is no margin call. On onchain platforms the money sits in your own wallet, and withdrawals need no requests and no waiting for settlement.
But prediction markets have risks of their own that an exchange does not:
Oracle and resolution. The payout depends on how the platform determines the outcome. When a market settles on the wording of an event, there can be disputes about what actually happened. In March 2025 a $7 million Polymarket market on a US-Ukraine rare earth minerals deal resolved “Yes” even though there was no deal: a large holder of the UMA oracle’s tokens pushed the answer through a vote, and “No” holders were not refunded. Price-based markets are more reliable, but even then everything rests on the oracle: an outage, a delay or a wrong price at settlement changes the outcome.Smart contract. The money and the payouts are held by code. A bug in the contract can lock or drain funds, and there is no higher authority that can reverse such a transaction.Stablecoin. Settlement is in dollar stablecoins, and they are not the same as dollars in a bank account. In March 2023, after the collapse of Silicon Valley Bank, USDC fell to about $0.87 over a weekend and took several days to return to $1.“This market resolved against the expectations of our users… this wasn’t a market failure.”Polymarket, on the disputed Ukraine deal market
Leverage, gaps and tails
Leverage in futures is built into the instrument. ES margin is 6–8% of notional, which means leverage above 10x whether you want it or not. To reduce it, you have to hold extra cash in the account that earns nothing.
With leverage, the risk of a position is set not by your stop but by the gap. A stop-loss fills at the first available price. If the market opens below your stop, the loss is whatever the gap made it. Futures are closed on weekends; the news is not.
Tails in traditional markets happen more often than a normal distribution suggests ( Cont, 2001):
January 2015. The Swiss National Bank dropped the franc cap, and EUR/CHF fell about 20% in minutes. Stops did not fill, and broker clients went into negative balances, meaning they ended up owing money: FXCM clients alone owed $225 million, and Alpari UK went insolvent.February 2018. VIX doubled in a day, and XIV, a short volatility product, lost more than 90% overnight and was shut down.April 2020. The WTI oil future went negative for the first time in history, down to −$37 a barrel. Models that did not allow for a negative price simply broke.August 2024. The yen carry trade unwound: the Nikkei fell 12% in a day, and VIX jumped above 60 before the US open.For the systematic trader. Position size is set not from the stop but from the worst gap. To survive a day like that you have to cut leverage, so capital works worse than in the backtest.
In an event contract the loss is capped at the entry price. A gap, a weekend, a 20% crash: at most you lose what you paid, and no more. A negative balance is impossible by construction. Position sizing is direct: you put in as much as you are willing to lose on this bet.
The flip side: a capped loss is not a small loss. In a yes/no contract you regularly lose 100% of the stake, so the variance of a single trade is high, and risk management moves to allocating capital across many independent bets.
Why options are expensive
Option prices are set not by “the market” in general but by the dealers and market makers who are on the other side of almost every trade. When they sell an option, they take on the risk of a sharp move and charge a premium for it.
That premium is measurable. SPX implied volatility (what is built into the option price) is on average higher than the volatility the market actually realizes afterwards: from 2016 to 2026, VIX was above realized S&P 500 volatility on 85% of days, by 4 points on average. The literature calls this the variance risk premium, see Carr and Wu, 2009 and Bollerslev, Tauchen and Zhou, 2009. The option buyer overpays on average: even when the direction is right, part of the gain has already gone to the dealer.
Execution costs come on top:
Bid-ask spread. As a percentage of price, it is much wider for options than for the underlying, especially for short-dated and far out-of-the-money strikes.Per-contract commissions plus exchange and regulatory fees. On multi-leg positions (like our call spread above) all of this is multiplied by the number of legs.Order flow is sold. Retail options orders in the US mostly go to wholesale market makers for payment for order flow. According to Bryzgalova, Pavlova and Sikorskaya (Journal of Finance, 2023), retail traders lose money on options on average, and the average spread on the cheap weekly options they prefer is 12.6% of the price. A large share of the losses comes not from bad forecasts but from execution costs.For the systematic trader. For an options-buying strategy to be profitable, its edge has to cover the dealer premium, both spreads and the commissions. Many strategies that work on paper end right here.
An event contract has no volatility surface, no Greeks and no dealer who is necessarily on the other side. The price is the probability of the event, set by the participants in the order book. One leg, one spread, an exact yes/no payoff.
This does not mean event contracts are always fairly priced. They have their own well-known distortions, such as the favorite-longshot bias: unlikely outcomes are systematically overpriced ( Snowberg and Wolfers, 2010). A study of Kalshi covering more than 300,000 contracts found that buyers of contracts under 10 cents lose more than 60% of their money, takers lose about 32% on average, and makers about 10%. But such distortions are no longer a permanent tax; for a systematic trader they are an opportunity.
The cost of data
A systematic strategy starts not with a trade but with a backtest, and a backtest starts with data. In traditional markets this is where the first serious bill arrives.
Real-time data. Exchanges charge for every feed and every user. The professional rate is many times the retail one, and you become a professional as soon as you trade money other than your own, for example for a fund.Non-display fees. If an algorithm reads the data rather than a human, exchanges require a separate license (see CME’s fee list). You pay extra, and usually more, for your bot looking at the order book.Order book history. Microstructure work, execution modeling and realistic backtests need L2 (the book aggregated by price level) and L3 (every order separately). Deep history for CME futures or OPRA options means terabytes of data and vendor bills (from Databento, for example) of thousands to tens of thousands of dollars a year. Options are especially heavy: hundreds of strikes and expiries per underlying.Licensing and redistribution. You cannot simply pass the data to a colleague or another fund, or publish it in a paper: every use has its own terms.For the systematic trader. In practice many independent systematic traders test on minute or daily bars because they cannot afford the book. Such a backtest does not see the spread, the depth or the queue, so it overstates execution. The gap between paper and reality starts right here.
In prediction markets the barrier is lower: the order book and trades are usually available through an open API, and on onchain platforms every trade is publicly recorded on the blockchain. Not every platform stores order book history, though, and you often have to record it yourself. Lucyd publishes the full L2 order book history for every market for free, in Parquet, one file per market (for example, one 15-minute BTC market).
Unequal access
In traditional markets everyone formally plays by the same rules, but in practice they trade in different markets.
Colocation. HFT firms’ servers sit in the same data center as the exchange’s matching engine (CME in Aurora, NYSE in Mahwah). Everyone else comes in over the network, milliseconds later, and for automated trading that is an eternity. Budish, Cramton and Shim explain why this race never ends.Microwave links. Radio relay links between Chicago and New Jersey carry the signal faster than fiber. When a future moves in Chicago, HFT firms in New Jersey know before anyone else. When rain jams the microwave links, everyone else’s trading costs go down, which is how researchers measured the price of that edge.The queue in the book. Orders fill first come, first served. The fast players are almost always first in line.“The high-frequency trading arms race is a symptom of flawed market design.”Budish, Cramton, Shim, Quarterly Journal of Economics, 2015For the systematic trader. On a medium horizon the problem is not that you lose the speed race: you are not even in it. The problem is adverse selection: your limit order fills when the price moves against you and does not fill when it moves your way. The backtest does not show it; in reality it is a constant leak.
In prediction markets the inequality is smaller. The book is public, everyone uses the same API, on onchain platforms every trade is visible on the blockchain, and wholesale market makers do not buy order flow from brokers. Speed matters here too, and market makers are still faster than everyone else, but the gap between the best and the average participant is orders of magnitude smaller than between an HFT firm in Mahwah and a retail bot in the cloud.
Expected value and the chop
Most of the time the market does not trend; it chops sideways. That is the core problem of systematic strategies in traditional markets: edge is spread very unevenly over time.
Trend systems make money on rare strong moves and give it back on false breakouts in between, sometimes for years. Their win rate is usually 30–40%, and almost all the profit sits in a handful of trades. Trending regimes are rare: strong directional moves take up a small share of days, the rest of the time the price chops sideways, and the system goes flat or loses for months, sometimes years. Not every pool of capital and not every investor can sit through that.Mean reversion strategies work the other way around: many small gains and a rare large loss in the tail, the very gap from the section above.
Hence the typical trap: trend following on Nasdaq-100 futures (NQ). The index has had a high Sharpe ratio and steady growth for the last fifteen years, and almost any trend system looks great on it in a backtest. But it has to be compared not with zero but with simply holding a long. The simplest rule, “long while the index is above its 200-day average, otherwise cash”, has returned 12.4% a year with a Sharpe of 0.82 since 2010, against 17.8% and 0.89 for buy and hold. The trend system’s drawdown is smaller (−22% vs −36%), but the return is lower and the Sharpe is no better: the system catches the same growth, only with late entries, exits on corrections and costs. In effect it is the same Nasdaq beta, diluted with cash.
For the systematic trader. In the end, edge either hides in the tails, gets eaten by the tails, or turns out to be disguised beta. The Sharpe is low, and telling a working strategy from luck on a daily horizon takes decades of data ( Harvey and Liu, Bailey and López de Prado): one instrument gives about 250 observations a year, and the market changes regime in the meantime.
In an event contract the payoff does not depend on the size of the move, only on where the price ends up relative to the strike. The expected value of a trade is direct: your probability estimate minus the contract price. If the model says 55% and the contract costs $0.50, the edge is 5 cents per contract, or 10% of the stake, with no adjustment for the price path or the size of the move.
The second difference is frequency. Markets of 5 minutes, an hour or a day run continuously: the 5-minute series alone is 288 markets a day. There are enough independent bets to find out within weeks, not years, whether the model has an edge. One caveat: neighboring markets share the same volatility regime, so they cannot be treated as fully independent.
Who this suits, and who it does not:
It suits probability models, volatility models (the price of an “above the strike” contract is essentially an estimate of the price distribution at expiry), microstructure and market making.It does not suit classic trend following. The payoff is capped at $1, so there is no convexity, no big win on a big move, which is what trend followers sit through the chop for.
The downside: liquidity
Everything above runs into one constraint, and it has to be said plainly: prediction markets are still orders of magnitude less liquid than traditional markets.
For scale: ES trades 1.5 to 2 million contracts a day, hundreds of billions of dollars of notional. The best price in the book usually holds hundreds of contracts, tens of millions of dollars. In a typical short-term prediction market the best price holds a few hundred dollars at most, even on Polymarket.
Why? Liquidity in prediction markets is a classic chicken-and-egg problem. Market makers go where there is good order flow, and traders do not come where the book is empty. To break the circle, platforms pay market makers rebates and liquidity rewards, and the money comes from traders through high taker fees. Polymarket’s 5- and 15-minute crypto markets work this way, for example: the taker fee is 0.07 × price × (1 − price) per contract, which peaks at 1.75 cents at a $0.50 price, or 3.5% of what you pay, and 20% of what is collected goes to market makers as rebates (more in our breakdown of Polymarket fees). In the end the market maker lives on subsidies rather than the spread, and the trader pays twice: in fees and in expensive execution in a thin book. For a systematic trader with a thin edge this is usually enough to kill the strategy.
Large market makers from traditional markets stayed away for a long time. Until recently there were almost no market making programs with clear terms, and committing large capital while competing on latency on equal terms with ordinary users does not pay for them. The telling exception is Kalshi, a regulated and centralized exchange: since 2024 Susquehanna has made markets there under an official program. A big player came where there is a regulator and clear terms. On onchain platforms the market is still left to a few small market makers who compete with each other for the same subsidies, and the quality of the book does not improve.
What this means for a systematic trader:
Strategy capacity. An edge of 5 cents per contract at $100 can disappear completely at $5,000: you move the price yourself. A strategy has to be judged not only by its expected value but by how much money can actually go through it.Slippage and partial fills. A backtest at the mid price draws trades that were never in the book. Execution has to be modeled on real depth, level by level.The edges of probability. Close to expiry, when the price goes to $0.05 or $0.95, the spread as a percentage of price shoots up and depth drops.Exiting before expiry. You can close early only if there is someone on the other side. Often the realistic plan is to hold until settlement.Dependence on market makers. The book rests on a few large participants. If they pull out during a sharp move, the book empties. To be fair, the same happens in traditional markets during shocks, just from a different starting depth.For the systematic trader. Today prediction markets are a venue for strategies with trade sizes in the hundreds, at most thousands of dollars, not for institutional money. For an independent systematic trader this is often an advantage rather than a limitation: the big players are not here yet, and inefficiencies last longer.
Summary table
Who should use what
Trend and CTAs with large capital: futures. They need convexity on big moves and capacity in the billions, and only futures have that.Volatility sellers: options. Options that are expensive for the buyer are income for the seller: the variance risk premium works in their favor. The price is the tails from the section on leverage.Probability and volatility models on short horizons: prediction markets. The price compares directly with the model’s estimate, and markets from 5 minutes are enough to test an edge quickly.Microstructure and small-scale market making: prediction markets. A public book, a shared API and a market where the large market makers are not yet present.Research and prototypes: prediction markets as a sandbox. Open order book data and small trade sizes let you test an idea on real execution for pennies, not for a data subscription.Hedging a large portfolio: traditional markets. Prediction markets do not yet have the liquidity for it.
Where Lucyd fits
Lucyd is an onchain prediction market for short-term Bitcoin Up or Down markets, from 5 minutes to a day. It is the same view as in the S&P example, only for Bitcoin: the Up contract pays $1 if the price at the end of the round is higher than at the start. Markets settle on the Pyth oracle price. We built the platform around exactly the problems described above:
Zero fees. Neither makers nor takers pay the platform a fee, so a strategy’s edge does not go to subsidizing market makers.Liquidity first, then mainnet. Lucyd currently runs on testnet, and mainnet is planned. We see liquidity as the platform’s main job, so we solve it first and only then open the market. Every series is quoted by our own market maker, so the chicken-and-egg problem is solved on our side rather than passed on to the trader.No hidden privileges for the market maker. Its only advantage is latency: it sits next to the matching engine. It gets no queue priority and no fee discounts. There will be no rebate program either: our own market maker is how we pay users for liquidity, instead of a high taker fee. As a result, execution should come out noticeably cheaper than on platforms that subsidize market makers at traders’ expense. The market stays open: other market makers can quote on the same terms.Free data. The full L2 order book history for every market in Parquet, with no subscriptions or licenses.One API for everyone. A public order book, a WebSocket for orders, and an MCP server for agents.
Read more: how Bitcoin Up or Down markets work, how they settle through Pyth, how to build a trading bot and where to get order book history.
FAQ
Are prediction markets better than options? For some strategies, yes. An event contract expresses a yes/no view exactly, in one leg, without paying a dealer’s volatility premium, and the loss is capped at the entry price. Options win on liquidity and capacity: a large position or a hedge for a big portfolio still belongs in options.
Is an event contract the same as an option? It has a digital payoff: it pays $1 if the event happens and $0 if not, and the price reads as a probability. Unlike a listed option, it has no volatility surface, no Greeks to manage and no dealer that has to be on the other side. The closest options equivalent is a tight call spread, which costs two spreads and two commissions.
Can you lose more than you put in on a prediction market? No. A contract is fully paid for at purchase, so the most you can lose is the price you paid. There is no margin, no margin call and no negative balance, unlike futures, where a gap can leave you owing your broker.
Can you trade prediction markets systematically? Yes. Order books and trades are available through open APIs, onchain platforms record every trade publicly, and short markets give you thousands of independent bets a year to test a model. The main limit is liquidity: strategies have to work with trade sizes in the hundreds to low thousands of dollars.
Why are prediction markets less liquid than futures? It is a chicken-and-egg problem: market makers wait for order flow, and traders wait for a full book. Most platforms subsidize market makers through taker fees, which makes execution expensive. Large market makers have so far come only to regulated venues with formal programs, such as Kalshi.
Sources
Carr, Wu. Variance Risk Premiums. Review of Financial Studies, 2009.Bollerslev, Tauchen, Zhou. Expected Stock Returns and Variance Risk Premia. Review of Financial Studies, 2009.Bryzgalova, Pavlova, Sikorskaya. Retail Trading in Options and the Rise of the Big Three Wholesalers. Journal of Finance, 2023.Bürgi, Deng, Whelan. Makers and Takers: The Economics of the Kalshi Prediction Market. Working paper, 2025.Snowberg, Wolfers. Explaining the Favorite-Longshot Bias. Journal of Political Economy, 2010.Budish, Cramton, Shim. The High-Frequency Trading Arms Race. Quarterly Journal of Economics, 2015.Shkilko, Sokolov. Every Cloud Has a Silver Lining: Fast Trading, Microwave Connectivity, and Trading Costs. Journal of Finance, 2020.Cont. Empirical Properties of Asset Returns: Stylized Facts and Statistical Issues. Quantitative Finance, 2001.Hurst, Ooi, Pedersen. A Century of Evidence on Trend-Following Investing. AQR, 2017.Harvey, Liu. Backtesting. Journal of Portfolio Management, 2015.Bailey, López de Prado. The Deflated Sharpe Ratio. Journal of Portfolio Management, 2014.Data: FRED (VIX, S&P 500, Nasdaq-100), Polymarket: Maker Rebates Program, CME: Market Data Fee List.
Originally published at https://lucyd.trade on October 27, 2026.
Prediction markets vs options and futures for systematic traders was originally published in Coinmonks on Medium, where people are continuing the conversation by highlighting and responding to this story.