
Bitcoin is facing renewed selling pressure after failing to continue its recent advance through the $88K resistance area. With BTC now trading around $82K, the market is approaching a key support zone that could determine whether the latest pullback remains a correction within the broader recovery or develops into a deeper bearish move.
Meanwhile, the Bull-Bear Market Cycle Indicator points to a more complicated market backdrop, suggesting that the price rebound has not yet fully resolved the broader cycle uncertainty.
Bitcoin Price Analysis: The Daily Chart
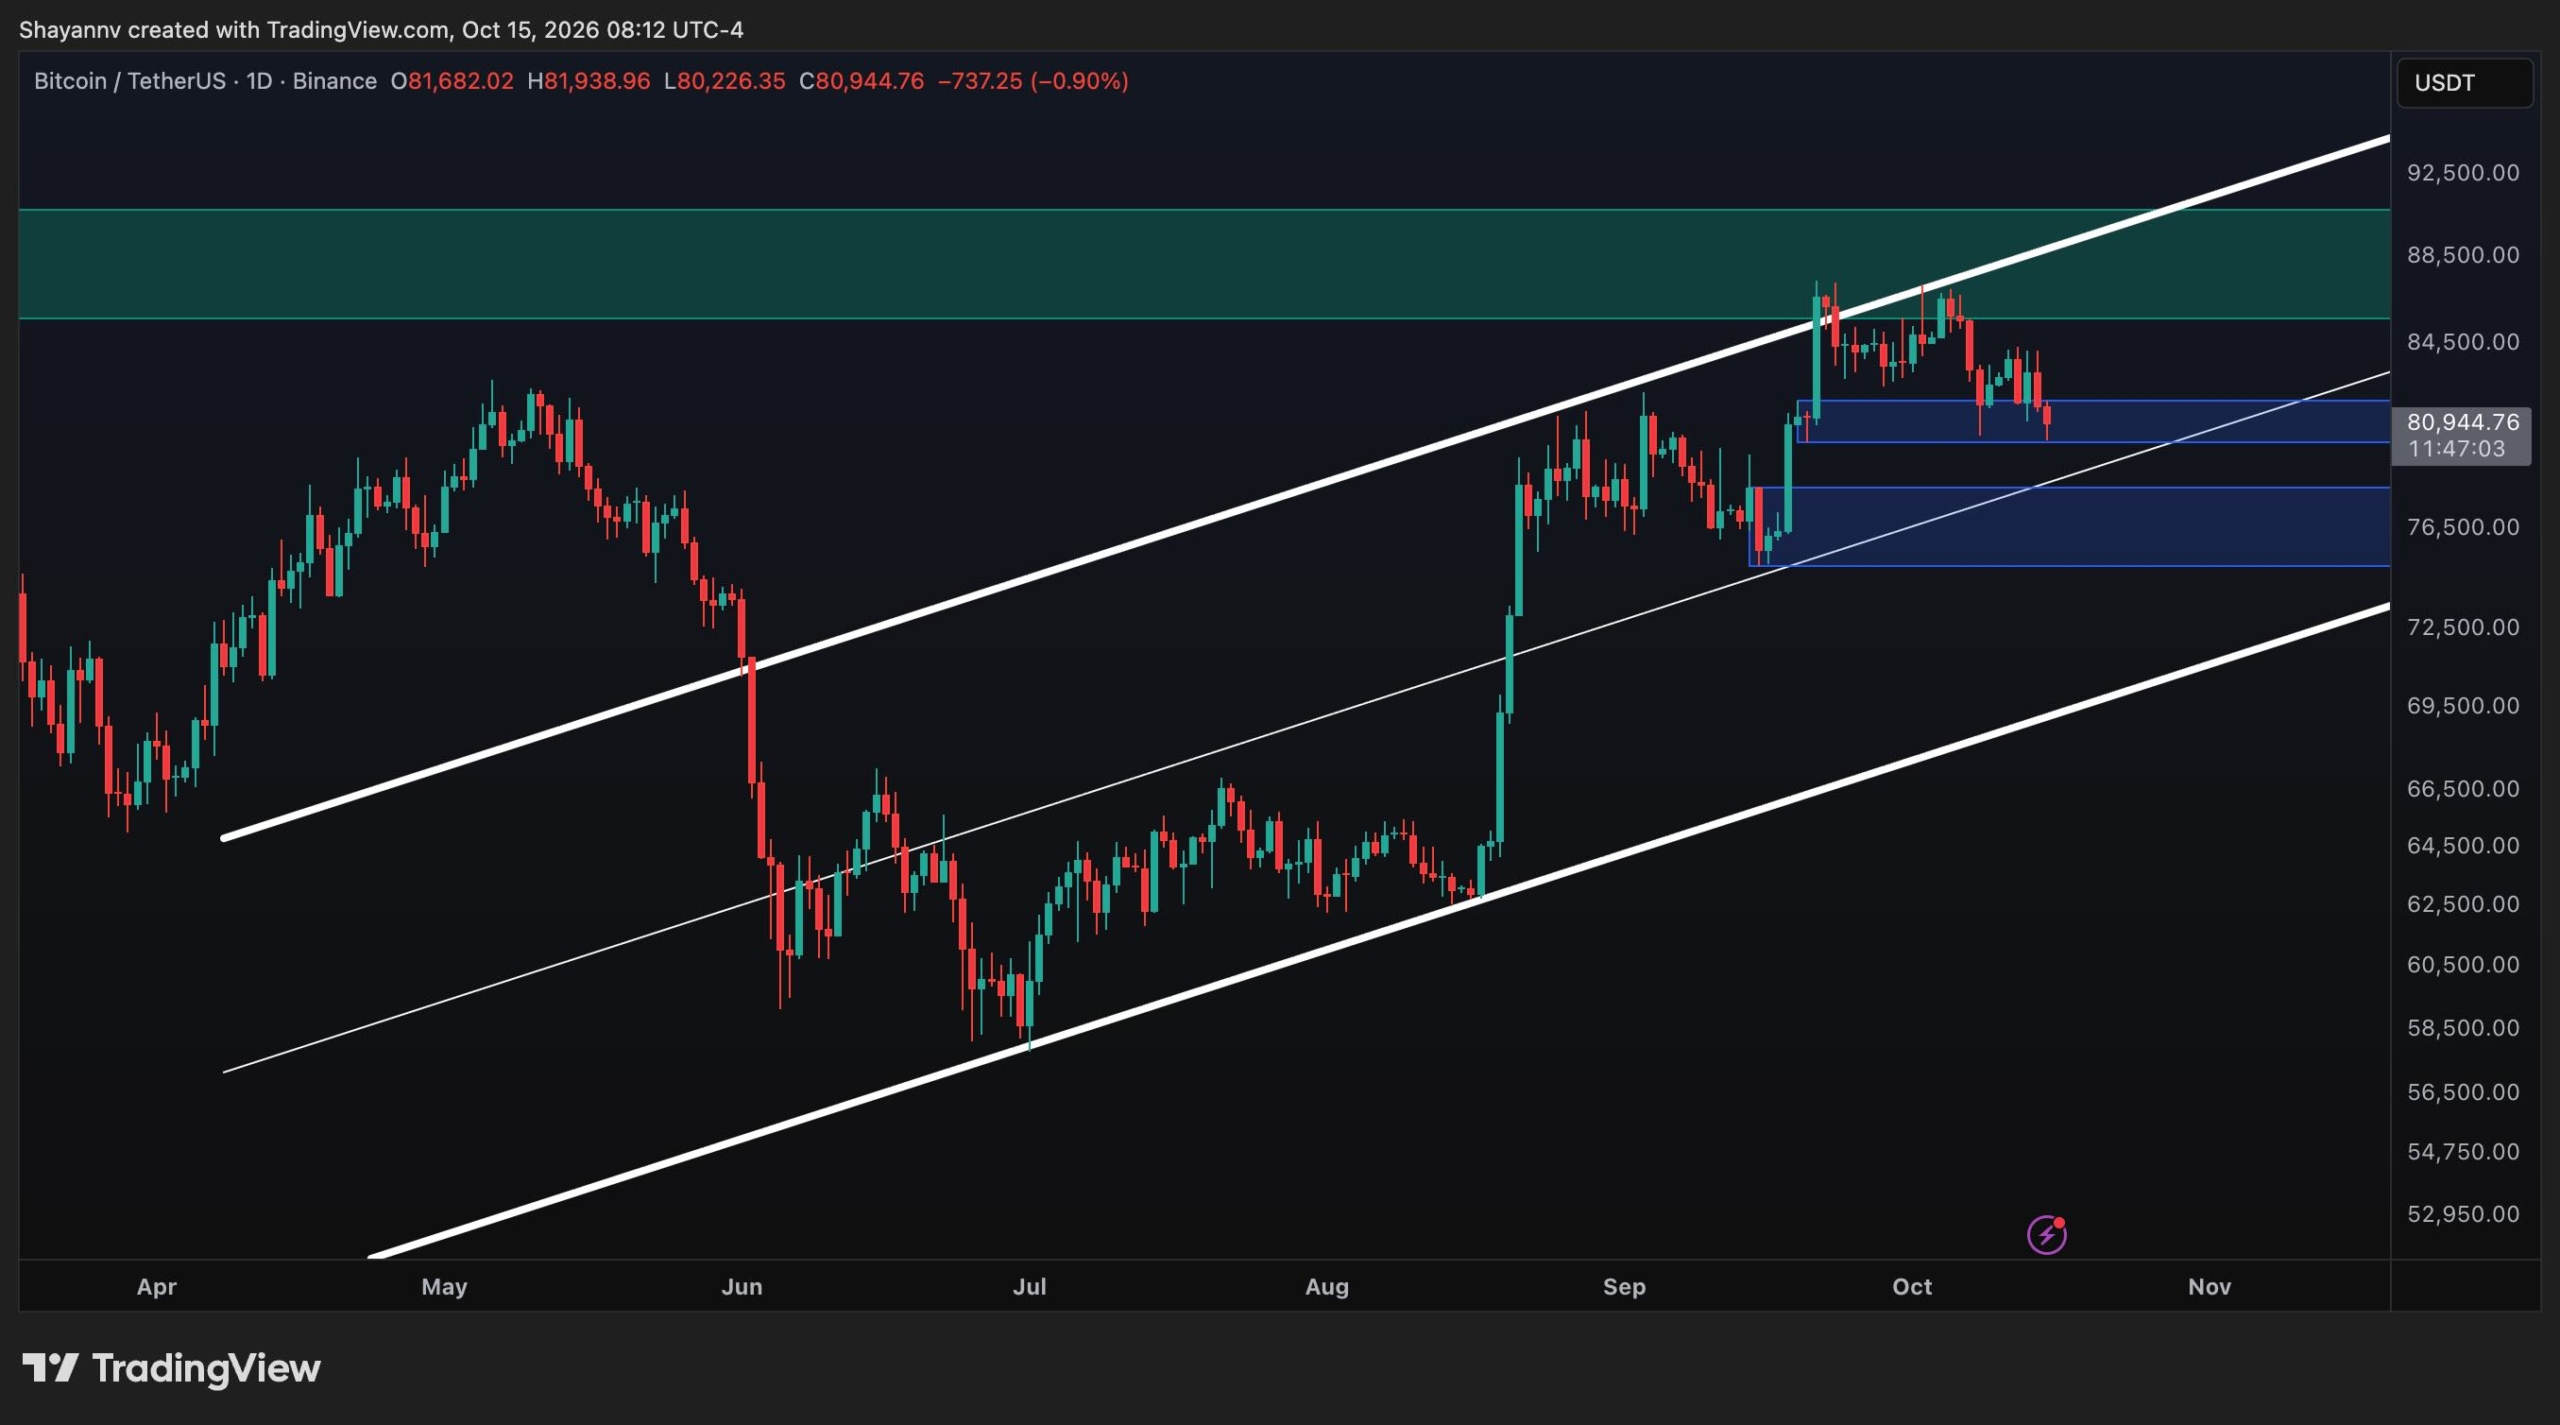
Bitcoin continues to trade within a broad ascending channel, with the lower and upper boundaries defining the broader recovery structure. However, the latest rejection from the $88K region has weakened the short-term outlook, pushing BTC back toward a critical support area.
The immediate focus is on the $80K-$81K zone, which represents the recent bullish order block before the final rally toward resistance. Bitcoin is currently trading around $82K after dipping below $80K briefly earlier today, as bears are trying to push the price below the mentioned demand zone. Yet, if buyers manage to hold, the market would likely stabilize and attempt another move toward the $88K area.
Below the $80K support level, the more significant demand zone is located around $75K-$77K. If the $80K area fails to hold on a daily closing basis, this lower region could become the next downside target.
For now, the ascending channel remains intact, but the rejection from its upper region and the subsequent loss of short-term momentum suggest that buyers need to defend support quickly. A breakdown through the lower channel boundary would weaken the bullish case and increase the risk of a full bearish reversal in the upcoming months.
BTC/USDT 4-Hour Chart
The 4-hour chart shows a clear deterioration in market structure. After repeatedly failing to establish a sustained breakout above $87K, Bitcoin began forming lower highs before experiencing another sharp sell-off. The latest decline has brought BTC into the marked buyers’ decision zone between approximately $80K and $81K.
The immediate concern is that price has slipped below the short-term rising trendline, which had been supporting the recovery from the September lows. This breakdown suggests that the trendline is no longer providing reliable near-term support. Bitcoin is now testing whether horizontal demand around $80K can absorb the selling pressure.
A successful defense of the $80K region could produce a relief bounce toward $84K short-term highs. However, buyers would need to reclaim this area rapidly to improve the short-term outlook. Until that happens, rebounds could encounter selling pressure before reaching the more significant resistance zone.
On the contrary, if the $80K demand zone fails, the next downside level would likely be the $75K order block, which is the base of the significant rally initiated in September. In any case, the short-term structure favors caution. Bitcoin is testing support after losing its rising trendline, and the next move will likely depend on whether buyers can defend the $80K area or sellers can turn it into resistance.

On-Chain Analysis
The Bull-Bear Market Cycle Indicator on CryptoQuant provides a more nuanced view of Bitcoin’s position than price action alone. The indicator measures the distance between the P&L Index and its 365-day moving average, with positive readings associated with bull-cycle conditions and negative readings associated with bear-cycle conditions.
The chart shows that the indicator spent a prolonged period in bearish territory from late 2025 through much of 2026, including an extended and deep negative phase during the first half of 2026. This coincided with Bitcoin’s decline toward the $60K region before the subsequent recovery.
More recently, the indicator has moved back into positive territory, with the latest readings appearing in the orange bull zone. The 30-day moving average has also turned sharply higher, while the 365-day average has flattened after its extended decline. These developments suggest that the market’s underlying cycle momentum has improved considerably from its earlier bearish phase.
However, the recovery in the indicator should not automatically be interpreted as confirmation that a sustained bull market is underway. The 365-day moving average remains an important longer-term reference, and the indicator’s recent transition into positive territory still needs to be assessed alongside price behavior. The latest pullback toward $80K adds further uncertainty to that assessment.
Overall, the cycle indicator suggests that Bitcoin’s underlying momentum has recovered from the earlier bearish phase, but the price chart shows that sellers remain active near resistance. The divergence between improving cycle momentum and weakening short-term price action makes the $80K support zone especially important.

The post Bitcoin Price Analysis: Has the $80K Drop Killed BTC’s Bullish Setup? appeared first on CryptoPotato.