
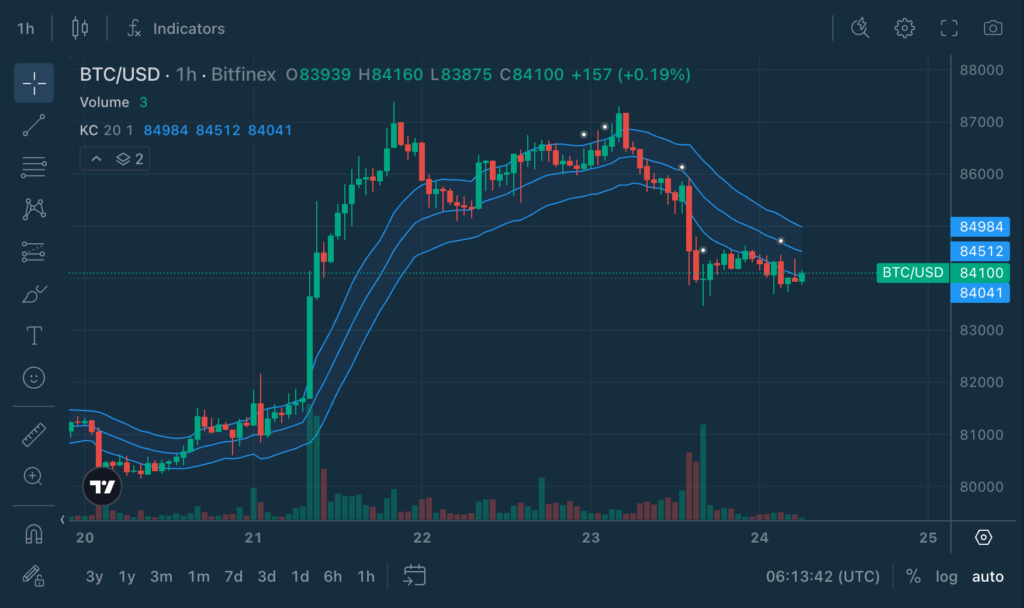
Bitcoin’s strong September took it from below $80,000 to a high of $87,392, with the price now settling around $85,000. Naturally, the question most traders have now is: Has the rally stretched too far, or is this a normal pause inside an uptrend that still has room?
Keltner Channels are designed to help answer exactly that.
In this installment of Chart Decoder Series, we explore how traders use Keltner Channels on Bitfinex to tell a strong trend from an overstretched move, using Bitcoin’s recent price action as a real-world example.
What are Keltner Channels?
Keltner Channels help traders see the direction of the trend and whether a price move is unusually big for current market conditions.
First introduced by commodities trader Chester Keltner in 1960, the indicator has since evolved into the version traders commonly use today. At its core, it combines two things: a moving average to track the trend, and a measure of volatility to judge how far price is moving away from it.
The modern Keltner Channel uses an exponential moving average (EMA) for the trend and Average True Range (ATR) to measure volatility.
It has three lines:
Middle line: A 20-period EMA showing the underlying trend.
Upper band: The middle line plus 2 × ATR.
Lower band: The middle line minus 2 × ATR.
Put simply: the middle line shows the trend, while the outer bands show how far price is moving relative to normal volatility.
Because the bands use ATR, they automatically adjust to the market. When volatility rises, the channel widens. When the market calms down, it tightens.
For example, a $3,000 Bitcoin move during a quiet market might push price outside the channel. The same $3,000 move during a volatile week might not.
That is what makes Keltner Channels useful. A move outside the channel does not simply mean “price moved a lot.” It means “price moved a lot compared with what has been normal lately.”
Most charting platforms also let you adjust three settings:
Length: The EMA period. A common default is 20.
Multiplier: How far the bands sit from the middle line. A common default is 2 × ATR.
ATR length: How much recent price action is used to measure volatility. A common default is 10 periods.
A lower multiplier creates tighter bands and more signals. A higher multiplier creates wider bands, so it takes a stronger move for price to break outside.
The easiest way to remember it: middle line = trend, outer bands = how unusual the move is.
How to read Keltner Channels
It starts with the middle line.
Rising middle line: The trend is up. Pullbacks toward the middle line are where trend traders look for support.
Falling middle line: The trend is down. Rallies toward the middle line are where sellers tend to reappear.
Flat middle line: No clear trend. Price is likely to swing between the bands.
Then look at where price closes relative to the bands.
Above the upper band: Upward momentum is unusually strong for current volatility.
Below the lower band: Downward momentum is unusually strong.
Riding a band: Often a sign that the trend remains strong, rather than an immediate reversal signal.
Back inside the channel: Momentum is cooling, but the trend may not be over.
Crossing the middle line: An early sign that the existing trend may be weakening.
Keep in mind: Keltner Channels measure how far price has moved relative to normal volatility, not where it goes next. A close above the upper band in a flat market is more likely to fade. The same close in a trending market is often the start of a run.
Always combine Keltner Channels with price structure, support and resistance, or indicators like RSI and MACD for confirmation.
Keltner Channels vs Bollinger Bands vs Donchian Channels
All three create a channel around the price. They are built differently and answer different questions.
Keltner Channels: How big are the typical price moves?
Use ATR to measure how much price typically moves during each trading period.
Larger trading ranges make the channel wider; smaller ranges make it narrower.
Because ATR is smoothed, the channel tends to adjust relatively gradually.
Bollinger Bands: Is price unusually stretched?
Use standard deviation to measure how far recent prices have been sitting from their average.
When prices stay close to the average, the bands tighten. When prices start moving much further away, they widen.
This makes Bollinger Bands particularly responsive when volatility suddenly changes.
Donchian Channels: Has price broken into new territory?
Simply track the highest high and lowest low over a chosen period.
The bands only move when price makes a new extreme.
Break the upper band and Bitcoin has made a new high for that lookback period.
Why Keltner and Bollinger work well together
Bollinger Bands react more quickly to volatility than Keltner Channels, allowing you to put them on the same chart to measure compression.
When the Bollinger Bands shrink inside the Keltner Channel, volatility is unusually low. Traders call this a squeeze. It doesn’t tell you which way price will break, but it often comes before a sharp move. When the Bollinger Bands expand back outside the Keltner Channel, the move is underway.
Keltner Channels in action
Let’s look at the BTC/USD daily chart on October 2, 2026.
Bitcoin’s September rally pushed price well above the upper Keltner band, eventually reaching close to $88,000. That told us the move was unusually strong compared with Bitcoin’s recent volatility.
After that surge, Bitcoin cooled and moved back inside the channel for several sessions. But the latest move has pushed price back above the upper band, with Bitcoin now around $86,155. That suggests bullish momentum is picking up again after the brief consolidation.
Upper band: $84,881
Middle line: $82,635
Lower band: $80,390
This gives traders a few simple levels to watch:
Above $84,881: Bitcoin is trading beyond its recent normal volatility range, signalling renewed bullish momentum.
Between $84,881 and $82,635: Momentum has cooled, but price remains above the rising middle line and the broader uptrend remains intact.
Below $82,635: A stronger sign that the current uptrend may be losing momentum.
In other words, with price pushing back above the upper band, Keltner Channels are signalling that momentum may be strengthening again.
Bonus Read: Keltner Channels + Bollinger Bands Together
Now let’s put Keltner Channels and Bollinger Bands on the same BTC/USD daily chart.
The difference becomes much easier to see. Keltner Channels (blue) move relatively smoothly, while Bollinger Bands (yellow) react much faster when volatility suddenly changes.
During Bitcoin’s September rally, the Bollinger Bands widened dramatically as volatility surged. After the rally stalled, they remained wide while price consolidated. Now Bitcoin has started pushing higher again, trading around $86,344.
Here’s what the two indicators are now telling us:
Keltner: After several days of cooling inside the channel, BTC has now pushed back above the upper Keltner band. That suggests bullish momentum is picking up again.
Bollinger: BTC is also moving towards the upper Bollinger Band at $89,208, but hasn’t reached it yet. The bands remain very wide, showing that volatility is still elevated.
Together: Keltner is signalling renewed bullish momentum as BTC pushes back above its upper band. Bollinger shows that volatility remains elevated, with price moving towards, but still below, its upper band. Together, they show a market gaining momentum again within an already high-volatility environment.
Keltner shows when the trend is gaining strength. Bollinger adds context on how stretched that move has become relative to recent volatility.
How to use Keltner Channels like a pro
Let the middle line set the direction
A rising middle line favors long setups and buying pullbacks.
A falling middle line favors short setups and selling rallies.
A flat middle line means a range. Band touches are more likely to reverse.
Don’t assume a band touch means a reversal
In a strong trend, price reaching or closing outside a band can signal momentum rather than an immediate reversal.
Wait for the price to close back inside the channel before reading it as a stall.
Wait for a close below the middle line before treating it as a possible trend change.
Use the middle line for pullback entries
In an uptrend, traders often look for price to pull back to the middle line, hold it and turn higher.
The lower band can act as a wider stop reference for swing positions.
Adjust the multiplier to your style
1.5 × ATR gives tighter bands and more signals, which suits active traders.
2 × ATR is the common middle ground.
2.5 to 3 × ATR filters out all but the strongest moves, which suits swing traders.
Pair it with structure
A close above the upper band that also clears major resistance is a high-quality signal.
A close below the lower band that also loses key support warns of further downside.
Power combinations
Keltner Channels + Bollinger Bands
The classic volatility pairing.
When Bollinger Bands move inside the Keltner Channel, volatility is compressed and a breakout may be building.
When they expand back outside, the move is underway. Use the Keltner middle line slope for direction.
Keltner Channels + RSI
RSI tells you how stretched the move is. Keltner tells you how unusual it is.
A close above the upper band while RSI is strong but not overbought suggests room to run.
A touch of the upper band while RSI is diverging lower is more likely to fade.
Keltner Channels + Chaikin Money Flow
A breakout above the upper band with CMF above zero shows real capital is behind the move.
A breakout with CMF flat or negative may be driven by short covering rather than fresh buying.
Keltner Channels + MACD
A pullback to the middle line that lines up with a bullish MACD crossover gives a stronger re-entry signal.
A close below the middle line with a bearish MACD crossover adds weight to a trend change.
Keltner Channels + Support and Resistance
A break above the upper band that also clears horizontal resistance is a high-quality signal.
A middle line that lines up with a former resistance level, as it does on Bitcoin’s daily chart now, gives that zone extra weight.
This helps traders avoid treating every band touch as equal.
Try it on Bitfinex
Log into Bitfinex
Choose any trading pair chart
Add “Keltner Channels” from the Indicators menu
Start with the common settings (20-period EMA, 2 × ATR). A lower multiplier tightens the bands, a higher one widens them.
Watch the slope of the middle line, whether price is closing outside the bands, and how pullbacks behave at the middle line. Use it alongside Bollinger Bands, RSI or CMF for stronger confirmation
Leverage Bitfinex’s zero trading fees to implement your strategies with zero trading costs
Bitfinex. Master Your Universe.
Explore the full Chart Decoder library:
SMA vs EMA for trend direction
MACD for momentum shifts
RSI for overbought/oversold zones
Bollinger Bands for volatility and price extremes
Stochastic Oscillator for timing reversals
VWAP for fair price detection
Volume + OBV for spotting smart money flow
ATR for volatility-based risk management
Fibonacci Retracements for market pullbacks
StochRSI for precision timing
Ichimoku Cloud Part 1 for understanding the 5 components of the cloud
Ichimoku Cloud Part 2 for mastering Cloud components & powerful indicator pairings
Accumulation/Distribution for detecting institutional buying and selling
Money Flow Index for tracking the strength of buying and selling pressure
Chaikin Money Flow for confirming real capital flow
Volume Profile Visible Range for broader market value zones
Volume Profile Fixed Range for isolating where value is building inside a move
Parabolic SAR for spotting potential trend reversals
Donchian Channels for catching breakouts
Rate of Change for measuring momentum behind a move
SuperTrend for riding trends and trailing risk
The post Chart Decoder Series: Keltner Channels: How Traders Tell a Strong Trend From a Stretched Move appeared first on Bitfinex blog.