
I compared ETH funding across Kraken, Coinbase, OKX and Hyperliquid. The rates looked wildly different until I checked what each number was actually measuring.
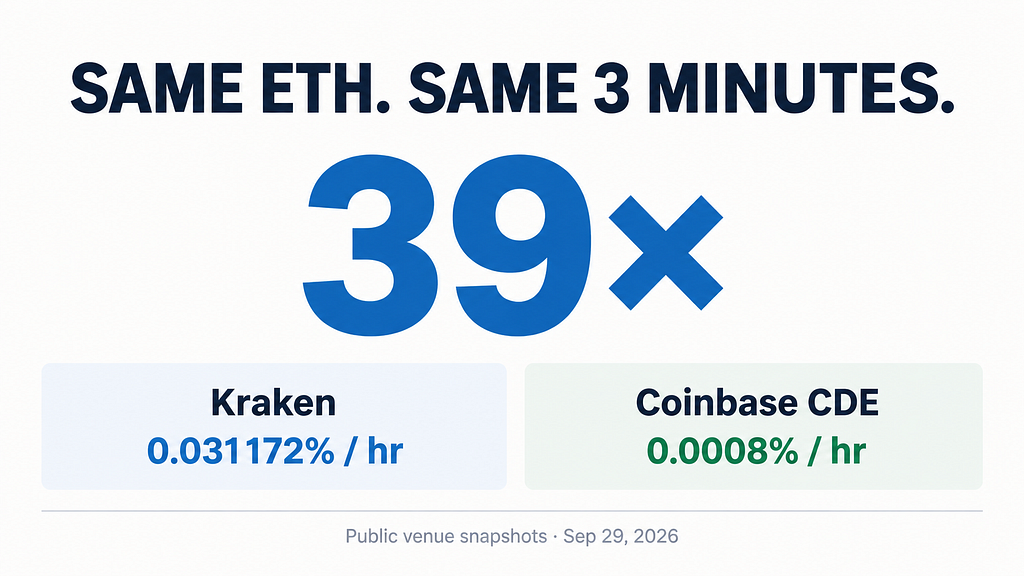
ETH funding rates observed on public Kraken and Coinbase CDE interfaces within the same short research window on September 29, 2026. The underlying observations were collected by the author; this editorial graphic was created with AI assistance.
Disclosure: AI assisted with research, drafting and editing. The market observations, screenshots and comparison described here were collected by the author on September 29, 2026.
I expected crypto funding rates for the same underlying asset to be easier to compare.
They weren’t.
At 09:50 UTC on September 29, Kraken was showing 0.031172% per hour for ETH perpetual funding.
By 09:52:50 UTC, I had captured three more public ETH derivatives screens: Coinbase CDE showed 0.0008%, OKX showed 0.01% for an eight-hour funding period, and Hyperliquid displayed 0.0013% alongside its hourly funding countdown.
My first reaction was that one of these numbers had to be misleading.
The more useful discovery was that the numbers were answering slightly different questions.
Before I could compare the rates, I had to compare the contracts, the clocks, and what each number actually meant.
Method note: I captured the four public venue interfaces between approximately 09:50 and 09:53 UTC on September 29, 2026. I did not place a trade. I recorded the displayed rates first, then checked each venue’s funding interval and contract documentation before normalizing the rates.
Four screens, four numbers
Here is what I captured during the short observation window:
Kraken — ETH Perp
0.031172% / hr · hourly
Coinbase CDE — nano Ether perpetual-style futures
0.0008% · hourly
OKX — ETHUSD UM X-Perp
0.01% · 8 hours
Hyperliquid — ETH-USDC Perp
0.0013% · hourly payment cycle
At first glance, these look like four versions of the same metric.
They are not.
The first problem becomes obvious as soon as the funding periods are written next to the percentages.
Why crypto funding rates are easy to compare incorrectly
A rate quoted for one hour cannot be compared directly with a rate quoted for eight hours.
The first mistake I made was comparing percentages before comparing their clocks.
Coinbase says its US perpetual-style futures funding rate is calculated hourly, based on the relationship between its futures and spot prices.
OKX states that funding for its X-Perps is settled every eight hours.
Hyperliquid uses another structure. Its documentation describes an eight-hour funding-rate formula, while funding is paid every hour at one-eighth of the computed rate.
That means the raw percentages need a common clock before they can be compared.
Using an eight-hour equivalent:
Kraken: 0.249376%Coinbase CDE: 0.0064%OKX: 0.0100%Hyperliquid: approximately 0.0104%
Something interesting happens after normalization.
OKX and Hyperliquid, which initially looked different because of the way their rates were displayed, land very close to each other.
Kraken still does not.
And that led to a second problem.
Same ETH does not mean the same contract
The underlying asset was ETH in all four observations.
The derivatives were not identical.
Coinbase CDE’s product is a US perpetual-style futures contract with its own clearing and funding process. Coinbase says the funding rate is calculated hourly, while the resulting cash adjustments are processed through its clearing system.
The OKX screen I captured showed an X-Perp, a long-dated derivative designed to behave similarly to a perpetual contract while retaining a distant settlement date.
Hyperliquid uses its own perpetual structure, funding formula and margin system.
Kraken has its own contract specifications and funding mechanics as well.
So this sentence:
“ETH funding was X%.”
is incomplete.
The better questions are:
Which ETH contract? On which venue? Over what funding interval?
The same asset name does not make two derivative products economically identical.
The 39× gap was real
The cleanest comparison in my screenshots was Kraken versus Coinbase CDE because both were showing hourly funding rates.
Kraken:
0.031172% / hour
Coinbase CDE:
0.0008% / hour
Dividing one by the other:
0.031172 ÷ 0.0008 ≈ 38.97
So, in those observations, Kraken’s displayed hourly rate was roughly 39× the Coinbase CDE rate.
That calculation is real.
What it does not establish is that Kraken is always 39× more expensive, or that the two contracts should normally have the same funding rate.
The observation describes a moment.
It does not create a permanent relationship between the venues.
The 273% headline that the same screen undermined
The Kraken number becomes even more dramatic if I annualize it.
0.031172% × 24 × 365 ≈ 273%
That would make a very clickable headline.
It would also be extremely easy to misunderstand.
It does not mean a trader should expect to pay or receive 273% over the next year.
It means something much narrower:
If that single hourly rate somehow remained unchanged for an entire year, its simple annualized equivalent would be roughly 273%.
The same Kraken screen gave me a reason not to treat that annualized figure as a forecast.
Alongside the current funding rate of:
0.031172% / hr
the interface showed a next funding rate of 0.0064350% / hr.
The next displayed rate was roughly 79% lower.
So a single screen contained both:
a current rate capable of producing an eye-catching annualized number;and a next displayed rate already far below it.
A mathematically correct annualization can still create an economically misleading impression.
The same problem appears when a trading strategy is tested on historical data: funding rates, borrowing costs and liquidation mechanics need to be treated as explicit execution assumptions rather than background noise. Forvest’s guide to backtesting vs forward testing explains why those assumptions can change what a strategy appears to achieve once it moves from historical simulation to live conditions.
I checked Kraken again one hour later
I also ended up with a small follow-up check.
I captured Kraken once at approximately 08:50 UTC and again at approximately 09:50 UTC.
In both public-interface screenshots, the displayed current funding rate was:
0.031172% / hr
and the next displayed rate was:
0.0064350% / hr.
That does not prove the rate normally remains unchanged for an hour.
Two observations are not a time series.
They only allow a much narrower statement:
In two Kraken screenshots taken roughly one hour apart, the same current and next ETH funding rates were displayed.
That distinction matters.
I can document what the interface showed twice.
I cannot use two screenshots to describe Kraken’s normal funding behavior.
Before sharing a funding screenshot, check three things
After doing this comparison, I would no longer start with the size of the percentage.
I would start with three checks.
Normalized comparison of ETH funding observations captured across Kraken, Coinbase CDE, OKX and Hyperliquid within the same research window on September 29, 2026. The data was collected by the author; the infographic was created with AI assistance. Different venues use different contract structures and funding mechanics, so the normalized figures should not be interpreted as economically identical products.
1. What is the funding interval?
One hour?
Eight hours?
Something else?
A percentage without its funding interval is incomplete information.
Two rates can look dramatically different before normalization and much closer afterward.
2. What contract are you actually looking at?
“ETH funding” sounds like a single market-wide number.
It is not.
The venue, contract structure, settlement design, collateral and calculation methodology can all matter.
Even products designed to behave similarly can have different mechanics underneath them.
3. Is the number current, next or annualized?
Those labels answer different questions.
A current funding rate describes the rate associated with a particular funding period.
A next or predicted rate refers to another period.
An annualized rate is a mathematical transformation of a shorter-period rate.
It is not automatically an expected annual return.
And none of those numbers, by itself, predicts ETH’s next price move.
The useful number was not the biggest one
I started this exercise thinking the interesting result would be:
Which venue has the highest ETH funding rate?
That turned out to be the wrong question.
The more interesting finding was how easy it was to build a bad comparison from four legitimate screenshots.
Same underlying asset.
Similar-looking funding labels.
Different clocks.
Different derivative structures.
Different meanings.
The 39× gap was real between the two observed hourly rates.
But understanding what that gap meant required more work than dividing two percentages.
That is what I would check first the next time I see a funding-rate screenshot shared as evidence.
A funding-rate screenshot is not a comparison until you know what the number is measuring.
Educational analysis of public derivatives-market data. No trades were placed for this comparison.
FAQ
Are crypto funding rates directly comparable across exchanges?
Not always. Funding intervals, contract design, collateral, price references and settlement mechanics can differ. The interval should be normalized first, and the underlying contracts should be checked before drawing a conclusion.
Does a high ETH funding rate predict ETH’s next move?
Not by itself. Funding describes conditions inside a derivatives market for a particular period. It can provide useful context about positioning and contract pricing, but a single funding-rate observation is not a directional price forecast.
Crypto Funding Rates: I Found a 39× ETH Gap in Three Minutes was originally published in Coinmonks on Medium, where people are continuing the conversation by highlighting and responding to this story.