
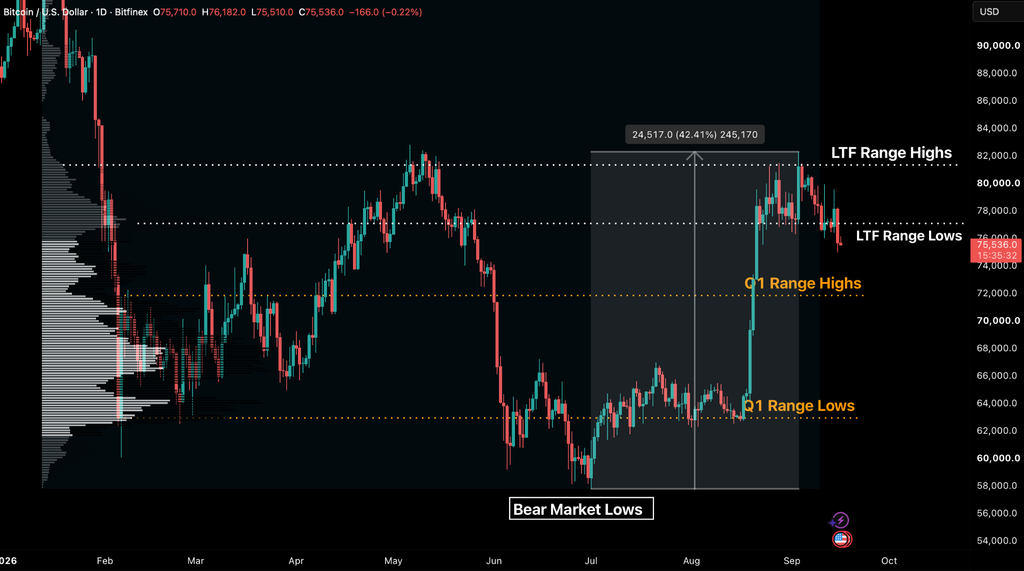
Until yesterday (15 September 2026), Bitcoin had spent 24 days from 21 August within a range bounded by a high volume node at $77,100 and a value area near $81,300. This range lost its footing and broke to the downside ahead of today’s Federal Reserve rate decision. Bitcoin closed Tuesday’s session at $75,702, down 3.2 percent on the day.
The close was the first below the $76,043 low recorded last Friday, 11 September, following the release of August Consumer Price Index (CPI) data. It is also now the third close below the $77,100 range floor formed over the previous six sessions. This drop in BTC activates the retrace scenario set out in our last Intelligence Update roadmap, where price could now revisit the $73,500 level. This level is the cost basis for holders of 3-6 months and puts in range the $70,956 short-term holder cost basis. It will only be invalidated if we reclaim $77,100 with significant spot volumes.
The Federal Open Market Committee (FOMC) announces its decision at 18:00 UTC today. Markets expect it to be the first rate hike of the year, marking a sharp reversal from expectations at the beginning of 2026, when markets were pricing in a cycle of rate cuts.
This Intelligence Update sets out why the market dropped, how the breakdown has affected positioning and the key levels below the current price following the range breakdown, along with what we want to see at each. It closes with the conditions under which a reversal back into the range remains possible.
Institutional Flows Slowed Down
Tuesday’s decline had several drivers. Macro pressure and news that the CLARITY ACT had failed to advance to the next stage set the backdrop, while Exchange Traded Fund (ETF) flows weakened after two weeks of slowing inflows. Short-term holder distribution and weakness in the bond market added further selling pressure. Liquidation data suggest that derivatives positioning reflected the move rather than caused it.
On Tuesday, US spot Bitcoin ETFs recorded a net outflow of $450.4 million. Fidelity’s FBTC accounted for $214.8 million and BlackRock’s IBIT for $161.7 million, together representing 84 percent of the total. It was the 33rd-largest daily outflow in the 687 sessions since the funds launched in January 2024, placing it within the top five percent of all sessions, and the 14th-largest of 2026.
The last outflow of comparable size was the $691.7 million redeemed on 25 June, following the previous failure to recover above the $80,000 level reached in May. That movement preceded the bear market lows in early July.
Short-term holders were the second source of selling. Exchange inflows from coins younger than 155 days rose from about 19,400 BTC to 33,100 BTC on Tuesday. Of that, 23,200 BTC was deposited at a loss, the largest such event in a month. On the largest offshore (non US) exchange spot venues, the loss-making deposits from that cohort reached 8,260 BTC, the most since 11 August, when BTC traded at $64,000.
Exchange inflows have been dominated by buyers who acquired BTC between one-to-six-months ago, since the range breakout in mid-August. More recent buyers are now depositing at a loss after BTC stalled at the range floor and then broke below it.
Deposits into US institutional products, including ETFs and wrapper products, remained at a typical 7,300 BTC in size. The coins moving onto exchanges are therefore from more recent, retail-sized buyers. They belong to the cohort that acquired 1.23 million BTC between $77,100 and $81,300 over the past four weeks and which is now sitting at a loss.
The timing of the breakdown also matters. BTC fell about $1,100 between 18:30 and 18:45 UTC on close to zero net taker flow on Bitfinex, suggesting resting bids were withdrawn rather than aggressively hit. That move also coincided with the failed CLARITY Act cloture vote.
For bitcoin, the bill had become a catalyst the market had positioned for in advance, despite carrying no direct flow implications. Its failure coincided with the 10-year Treasury yield trading at 5 percent for the first time since 2023 and a 20-year Treasury auction that tailed on record-low foreign demand.
This shift expands the hurdle rate across every main fiat currency instead of just the greenback. The key metric to monitor is whether the US 10-year yield can sustain the five percent mark following today’s FOMC rate hike which is already priced in.
The macro headwinds facing BTC appear to have reached their peak for the current cycle, yet spot prices have so far barely broken below the range lows. Whether this break develops into sustained downside momentum will largely depend on macro catalysts. For now, we expect ETF flows to provide a clearer signal of institutional positioning than the options market.
What the Breakdown Did to Positioning
The range breakdown led to a momentary decline in open interest (OI), before the market rebuilt its positioning.
The 3.5 percent peak-to-trough decline on 15 September saw a $1.7 billion decline in global OI, but this was quickly replaced.
Aggregate bitcoin futures OI across venues stood at $52.15 billion on the morning of 16 September, against $52.1 billion before yesterday’s breakdown.
The liquidations that did occur amounted to about $571 million in long positions across all coins on 15 September, against roughly $100 million in shorts. This marked the largest long liquidation since 22 August, with BTC and Ether each accounting for roughly $190 million each.
When $77,100 was first tested on 10 September, total liquidations reached $562 million, 86 percent of which were long positions. That suggests bullish positioning on perpetual trading pairs remained resilient until this week, despite multiple tests of the range floors and attempts to break down throughout the lower timeframe range.
A detailed breakdown of aggregated taker flows shows that the market in general is continuing to add long exposure as price “slow bleeds” lower. Longs are being re-added as funding remains positive, albeit not overheated, even as price continues to decline with lower highs and lower lows. This is consistent with the recovery in open interest and contrasts with conditions typically seen during a capitulation-like flush which happens at the end of trends and doesn’t lead to further continuation. In those scenarios, contrary to what we’re seeing now, funding turns negative and open interest falls sharply.
Aggregated cumulative volume delta data, which shows taker order flow by volume, indicates that since the breakdown below $77,100, buy-side taker activity has increased alongside open interest, with funding remaining positive on each positive price move. This is consistent with the dip-buying behaviour in perpetual markets we have referenced above.
The one reading that has not normalised is the spot discount at Coinbase, which widened from 0.03 percent on Monday to 0.08 percent on 16 September’s daily open, indicating weaker spot demand on Coinbase relative to other venues.
At this level it is at its deepest discount since 15 August, when BTC was trading under $65,000 before the subsequent breakout.
Although there are still some passive flows currently absorbing ETF selling, the buyer aggression needed to push BTC above the $77,000 range remains absent.
The options book also changed shape without changing direction. OI on the 18 September expiry has grown 22 percent this week, with calls up 30 percent and puts up 12 percent, pushing the puts-per-call ratio down from 0.82 to 0.70. On the 25 September quarterly, the 25-delta risk reversal moved to puts at every dated tenor: 25 September -1.51 from -0.39, October -2.35 from -0.95 and December -2.08 from -0.65.
This implies that, despite the FOMC meeting, near-term options positioning remains likely unhedged, while longer-dated expiries are still bid for downside protection. This is consistent with participants expecting to hold through the event and hedge for what follows.
While leverage remains relatively balanced, with limited liquidation risk following the heavy long liquidations over the last trading session, the market is now largely positioned for a hike. In the wake of the failed CLARITY Act vote, the greater surprise may therefore be to the upside, depending on the Fed’s accompanying guidance and how treasury yields respond.
Levels Beneath Spot, and What We Want to See at Each
Tuesday’s close left BTC below the True Market Mean of $76,500, the average acquisition price of every active holder. The average participant is now holding at a loss. Whenever price breaks out or down from a range, it will often either reclaim the range after a deviation or expand in the direction of the break. In the latter scenario, cost-basis levels where significant transaction activity has occurred become important in identifying potential support if BTC continues to move lower.
The average BTC cost for Strategy, the largest corporate holder, is also under pressure. The company’s 845,050 BTC carry an average cost of $75,412. Tuesday’s low traded below that level before the session closed 0.4 percent above it. Strategy also made no BTC purchases for a second consecutive week, instead allocating $139.3 million to its STRC preferred stock at about $98, against $100 par value.
With the corporate-treasury breakeven near $80,500 and the US ETF breakeven near $86,000, neither group of institutional holders is a natural buyer at $76,000.
The following table sets out the key levels below the current price and the reading required at each before a floor can be confirmed.
LevelWhat it isWhat we want to see there$74,985 to $75,412Tuesday’s low; Strategy’s average cost; the $75,000 to $76,000 long-liquidation cluster mapped last week, now cleared with over $500 million in liquidationsRetests need to hold. A sustained move below this zone would signal weakness. ETF flows should stabilise and 18 September $75,000 puts should not see a material rise in open interest.$73,500 (cohort reading $73,190)Three-to-six-month holder cost basis, the published first retrace targetShort-term holder exchange inflows should fall back below 20,000 BTC per day. Supply in profit should decline more slowly than the 371,000 BTC per $1,000 seen on the way down last week, while the altcoin median should fall by less than 1.4 times Bitcoin.$71,300Short-term holder realised price; $70,000 to $71,500 volume node as confluence as well as the cost-basis distribution here being close to 350,000 BTCSpot discount at US institutional venues should narrow rather than widen, while dip buying on perp behaviour should ease.$62,500 to $71,000The Q1 range; the $62,000 floor and the $60,000 to $63,000 long-liquidation cluster below it
Break below the STH-RP essentially confirms a break down into this range againThe bear market regime continuing: supply in loss above half of circulating supply. We would treat a close inside this band as the end of the post-August structure and back into a bear market regime, not a dip within it
Altcoins Retraced Their September Gains
The altcoin leg that led the first week of September has round-tripped. From 1 to 8 September, all 28 of the largest non-bitcoin pairs we track closed higher, with a median gain of 10.3 percent against 1.4 percent for bitcoin. From 8 to 15 September, 27 of the 28 closed lower, with a median loss of 7.9 percent against 3.7 percent for bitcoin.
Month to date, the median alt is down 0.2 percent and only five kept more than half of their first-week gain. Notably, Zcash is up 33.6 percent on the month, mainly driven by the first US spot ETF for the asset.
How the leg unwound matters more than the fact that it did. On Monday, when bitcoin bounced 1.3 percent, the alt median was flat at -0.1 percent. On Tuesday, when bitcoin fell 3.3 percent, the alt median fell 4.9 percent, a down-beta of 1.46.
This is the fourth occurrence of a pattern we first identified in May. Altcoins have tended to underperform during BTC-led rebounds but amplify declines when Bitcoin falls, suggesting that much of the move is being driven by leveraged perpetual positioning rather than sustained spot demand. The liquidation split supports that view: Ether long liquidations on Tuesday matched Bitcoin’s at roughly $190 million, despite Ether’s market being around one-sixth the size.
Median return of the 28 largest non-Bitcoin pairs against Bitcoin, 1 to 8 September and 8 to 15 September, with the 14 to 15 September down-beta of 1.46.
What Macro Explains, in Numbers
Bitcoin was the worst performer in our cross-asset set from 8 to 15 September, down 3.7 percent. The asset was down against gold, the S&P 500, the Nasdaq and the dollar, while the 10-year Treasury yield rose from 4.8 to 5 percent and the 10-year inflation-indexed yield closed at 2.62 percent, the real-yield channel we identified last week. Its 10-day correlation with the S&P 500 has risen to 0.76 and with the Nasdaq 100 to 0.66, from 0.20 and 0.15 on 11 September, while its correlation with gold has fallen to 0.51 from 0.79. Bitcoin is trading as the high-beta end of the equity complex into this decision, not as the alternative to it.
The post BTC Needs Sustained Buying to Break Above its Floor appeared first on Bitfinex blog.