
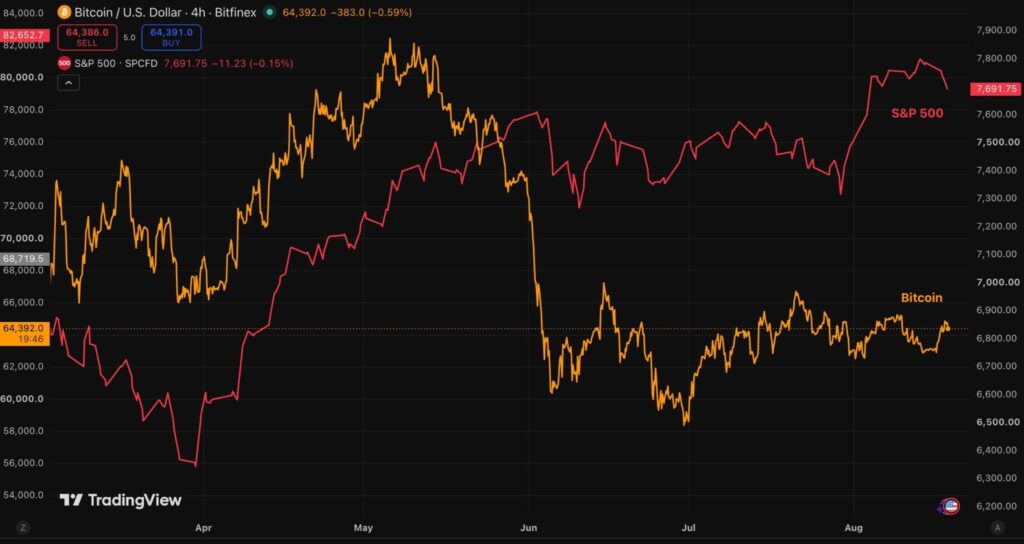
Wall Street and bitcoin markets have been swapping scripts this week. The S&P 500 has fallen for three consecutive sessions since Thursday’s record close, pressured by a 30-year Treasury yield at 5.31 percent, its highest level since 2007, and by Brent crude near $91 as the United States and Iran allow their negotiating window to expire.
Bitcoin, which has spent the summer trailing every equity benchmark, rose 2.6 percent on August 17 and followed through yesterday to close at $64,775, its highest close in 10 days. BTC fell 14 percent in the first week of June, the worst BTC weekly performance in 455 days at that time. Since then, price has been confined to a narrow range: $60,795-65,700. There have been no weekly closes outside that band, and volatility and spot trading volume have both fallen considerably.
The positive move this week has been driven by both an identifiable engine and an identifiable vacuum. The engine is the return of the spot Exchange Traded Funds (ETF) bid, with $486.8 million added across the last two sessions. The vacuum is inherent in spending data, which shows the market’s capacity to take profit has been largely exhausted: long-term holders are realising losses (albeit minimal) at the deepest ratios since June, short-term holders are transacting at break-even and the aggregate profit ratio of every coin moved on-chain has now closed below par for 10 consecutive sessions. The cohorts that have been selling into strength (and subsequent retests of the range highs) have almost nothing left to sell at a profit or breakeven.
The Tape Inverts
For the first time since the Iran-US conflict caused correlation breakdowns and market volatility in early March, BTC advanced while equities retreated. The recovery began from Sunday’s weekly low of $62,724 and, unlike every prior approach to the ceiling within the short-term range, it was supported with a volume spike.
Usually, large volume spikes accompany tests of range-lows, signaling taker participation and aggressiveness. Rangehigh retests have not shown the same behaviour.
Tuesday’s high of $65,080 was the seventh daily high above $65,000 since 5 August, all seven within the psychological and cost-basis band of $65,000-65,700. The market has still not closed a single day above that level since 26 July. The manner in which the range highs are now being tested however is different from earlier attempts.
Two sessions closed the entire month’s relative-performance gap. A week ago, BTC was up 1.2 percent in August compared with the S&P 500’s 3.1 percent. s As of Tuesday’s close BTC is up 2.9 percent on the month against 2.7 percent for the S&P 500, which has slid for three straight days to a two-week low as semiconductor names sold off under rising yields and oil. The Nasdaq 100 however, is up 4.3 percent. There has been evident decoupling and decorrelation between equities and crypto since July, primarily seen in equities rising while BTC remained stagnant. This week, it appears that bitcoin is trading its own supply arithmetic while equities finally take the toll of macro in the form of treasury yield movements and energy prices.
Nothing Left to Take Profit On
Every cohort that is spending is doing so without profit. The adjusted Spent Output Profit Ratio (aSOPR), which compares the price at which moved coins were acquired with the price at which they were spent, has closed below 1 for 10 consecutive sessions through Tuesday, marking its sixth run of 10 or more days this year.
aSOPR filters for meaningful on-chain transactions to map the cost-basis ledger. It has remained pinned below the 1 parity line for the entirety of this bear market since the November break under $90,000. The ratio measures the difference between acquisition and spending of coins; readings under 1 signal that the average coin moved was done so at a loss.
Since the October peak, the weekly moving average of the metric has climbed to break-even nine separate times, only to be met with a wall of exit liquidity and near break-even selling. Each approach to par triggered an intensification of sell pressure, a pattern of overhead supply stubbornness where sellers treat break-even as a gift. Consequently, price discovery remains trapped in a regime where the aggregate participant is forced to realise losses.
Relative to previous bear cycles, the current correction appears historically mild. Prior drawdowns spent longer durations at deeper discounts before finding a terminal floor. A structural shift in the trend requires aSOPR to reclaim and hold above 1, signaling that supply absorbed during the lows is being spent at a premium. Such a flip would confirm that fresh demand is sufficiently robust to support a sustained advance against the profit-taker.
Long-term holder (LTH) SOPR averages 0.83 over the past week and printed 0.69 on Sunday, the deepest single reading since 1 July at the $57,803 cycle low. Monday and Tuesday of this week, printed 0.81 and 0.78: the average coin leaving the cohort was sold 19-22 percent below its purchase price. Even though the amount of LTH supply has remained relatively constant, this signals that the average LTH is moving coins at significant losses. Dividing spot by these ratios places the sellers’ acquisition costs between roughly $80,000 and $91,500. The loss-taking is climbing the cost curve toward the top-most buyers of late 2025.
In December we expressed that long-term holder sell pressure approaches saturation as the two-year supply overhang clears.This is what the terminal stage of that process looks like in the tape.
The LTH vs STH SOPR ratio shows a steady downtrend since the all-time high (ATH) of $126,110 was reached in October 2025. STH supply distribution still outpaces LTH supply distribution significantly, which is also a late bear-market signal.
Short-term holders carry no margin either. Their SOPR has held within one percent of break-even for 36 consecutive days and within half a percent for all of August. Profit-taking capacity is therefore fading across both cohorts at once: the older cohort’s spenders are underwater, the younger cohort’s are flat, and the supply that does hold large profits is the smaller cohort within the LTH category. The LTH realised price sits near $49,110, some 32 percent below spot and is not moving at all. The supply available to be spent at a profit is increasingly constrained and the constraint favours bullish price action by mitigating selling interest at the range highs.
Eight Times the Issuance
The ETF complex returned as a buyer and the thinned sell side amplified the effect on price. The $297.5 million net inflow reported for 17 August was the complex’s largest single daily inflow since the first week of August and 18 August’s $189.3 million made it the first back-to-back green prints since 6 and 7 August.
Together, they absorbed roughly 7,600 BTC, more than eight times the roughly 900 BTC mined over the same two days. The composition matters as much as the size: Fidelity’s FBTC, last week’s heaviest redeemer at $153.1 million, took in $135.8 million across the first two sessions of this week and BlackRock’s IBIT was also positive on both days. Ether ETFs added $102.3 million over the same two days after their five-week streak ended.
The corporate treasury complex, meanwhile, added to the move by way of no disclosed sales over the past week. Strategy’s Monday 8K filing disclosed no Bitcoin purchase for a seventh consecutive week and, notably, no sale either, ending a three-week selling sequence. The firm raised $333.7 million from common stock sales and lifted its dollar reserve to $4.8 billion.
Neither of the demand engines has yet produced a trend.
Positioning Did Not Chase
The rally was spot-financed and options cheapened while it happened. Perpetual funding held close to neutral through both sessions this week, so the move was not levered long and there is no crowded long-biased positioning to have any chances of a flush.
The 30-day implied volatility index sits at 34.6, lower than before the rally began. The at-the-money ladder is cheaper on every tenor than a week ago: 23.1 percent for 21 August, 26.6 percent for 28 August and 34 percent for 25 September.
The 28 August expiry spans Kevin Warsh’s first Jackson Hole economic symposium keynote as Federal Reserve chair and at 26.6 percent implied, it prices a daily break-even move of about 1.4 percent, or roughly $900.
Options traders are essentially being charged less for the first new-chair Jackson Hole debut since 2018 than the premiums for last week’s Consumer Price Index (CPI) print. A book this light cuts both ways: nothing forces a squeeze and nothing says conviction stands behind any trending move in either direction. The net aggregate expectation is that the range would either hold or any move would be positive but not particularly volatile.
Key Metrics
MetricReadingBullish SignalBearish SignalRange $60,800-$65,700Seven daily highs above $65k since 5 Aug, zero closes aboveSustaining above $65,700Sustaining below $60,800Profit ledgeraSOPR below par 10 straight days; LTH-SOPR ~0.83aSOPR reclaims 1.0 on an advanceLTH loss-taking deepens toward 0.7 and belowETF flows+$486.8m Mon-Tue after a -$385.2m weekFull green week, IBIT positiveRed prints resume below $65kCost basis59.2% supply in profit; STHCB $67,202 overheadHolds above the $63,500 nodeSustained return below 50%Cross-assetBTC +2.9% Aug vs S&P 500 +2.7%; 30Y at 5.31%Divergence survives Jackson HoleLong-end selloff pulls all risk assets
The post Profit-taking Becoming Exhausted as BTC Continues to Hit Resistance appeared first on Bitfinex blog.