
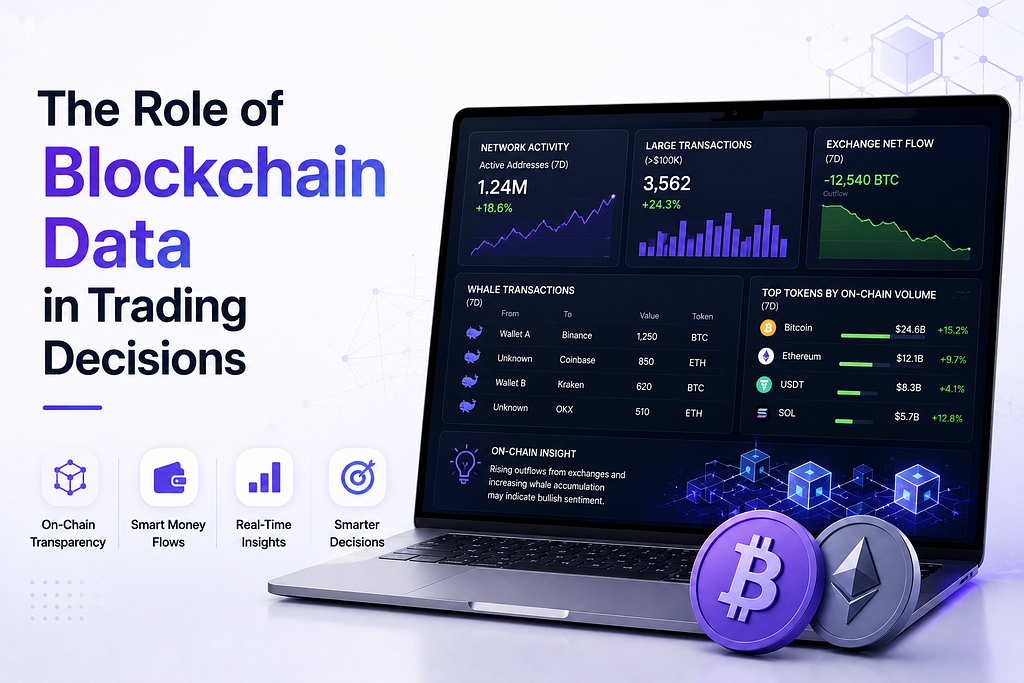
Learn how blockchain data helps crypto traders understand market activity, capital flows, investor behavior, and risk before making trading decisions
Crypto traders have access to more information than ever. Price charts, trading volume, order books, funding rates, social sentiment, and macroeconomic data can all help explain what is happening in the market.
But crypto has something traditional markets generally do not offer at the same level: a transparent record of transactions and asset movements.
Every transaction recorded on a public blockchain leaves behind data that can be analyzed. Traders can use this information to study wallet activity, exchange flows, network usage, token supply, and the behavior of different groups of market participants.
This is where blockchain data becomes useful.
It does not tell traders exactly where the price will go next. Instead, it provides another layer of information that can help explain why market conditions may be changing.
What Is Blockchain Data in Trading?
Blockchain data refers to information recorded directly on a blockchain network.
This includes transactions, wallet balances, token movements, smart contract interactions, network activity, and changes in supply. When this raw information is processed into measurable indicators, traders can use it for on-chain analysis.
For example, instead of simply seeing Bitcoin’s price rise, a trader can investigate whether:
More coins are moving into or out of exchangesLarge wallets are becoming more activeNetwork activity is increasingLong-term holders are selling or accumulatingStablecoin liquidity is entering the marketThe supply of an asset is becoming more concentrated
These details can provide context that a price chart alone cannot.
Research has also explored the relationship between blockchain-derived variables and cryptocurrency price behavior, including metrics such as Bitcoin’s hash rate, mining difficulty, and transaction costs.
Why Blockchain Data Matters to Traders
Traditional technical analysis primarily focuses on what is happening in the market.
Blockchain analysis can provide clues about what is happening underneath the market.
That distinction matters.
A cryptocurrency may be experiencing a strong price rally, but if network activity is weak and larger holders are distributing their holdings, the rally may deserve closer examination.
On the other hand, a market that appears quiet on the price chart may show increasing network usage, accumulation, or capital movement that suggests something is changing beneath the surface.
The goal is not to replace technical analysis with blockchain data. It is to combine different sources of information to build a more complete market view.
Key Blockchain Metrics Traders Watch
Not every blockchain metric is equally useful for every trading strategy. The most valuable indicators depend on the asset, timeframe, and market conditions.
Still, several categories are particularly useful.
1. Exchange Inflows and Outflows
Exchange flows track assets moving between wallets and cryptocurrency exchanges.
Large inflows can indicate that holders are moving assets toward exchanges, potentially increasing the supply available for trading. Outflows can indicate movement away from exchanges, although the reason behind a transfer cannot always be determined from the transaction alone.
This is why exchange flows should be treated as context rather than automatic buy or sell signals.
A sudden increase in exchange inflows, for example, becomes more meaningful when it occurs alongside other evidence such as increased selling volume or weakening price structure.
2. Active Addresses
Active addresses measure blockchain addresses participating in transactions during a particular period.
Growing activity can indicate increased network participation or usage. Declining activity may suggest that interest in the network is weakening.
However, an address does not necessarily represent one individual user. Exchanges, businesses, applications, and large holders may control multiple addresses.
Therefore, active-address data needs to be interpreted carefully rather than treated as a direct measure of the number of people using a network.
3. Transaction Volume
Transaction activity provides another view of network demand.
When transaction activity increases significantly, traders can investigate whether the change is connected to genuine network usage, speculative activity, token transfers, or a particular event.
A growing price combined with stronger underlying network activity can tell a different story from a price increase occurring while blockchain activity remains stagnant.
4. Whale Activity
Large transactions can attract considerable attention because major holders can have a meaningful impact on liquidity and market sentiment.
Tracking large wallet movements can help traders identify periods when significant holders are moving assets.
But there is an important caveat: a large transfer does not automatically mean a whale is buying or selling.
A wallet may move funds between personal addresses, custody providers, or other services.
The transaction needs to be interpreted in context.
5. Supply Distribution
Blockchain data can also show how an asset’s supply is distributed among different wallet groups.
Traders may examine whether larger holders are accumulating, distributing, or remaining inactive.
Changes in supply distribution can be particularly useful when studying longer-term market behavior because they provide insight into how ownership is shifting over time.
6. Realized and Unrealized Profit or Loss
Some on-chain analytics estimate whether holders are sitting on profits or losses based on the price at which assets previously moved.
These metrics can help traders understand the economic position of market participants.
For example, when a large portion of the market holds significant unrealized profits, traders may pay closer attention to potential profit-taking. Conversely, prolonged periods of unrealized losses may indicate a market where participants are under pressure.
These metrics are most useful when combined with price structure and broader market conditions.
Blockchain Data and Market Sentiment
One of the most interesting uses of blockchain data is understanding investor behavior.
Traditional sentiment indicators often rely on surveys, social media activity, news, or market positioning.
Blockchain data provides another perspective by observing actual asset movements.
For example, traders can study whether coins are becoming increasingly active, whether holders are moving assets to exchanges, or whether certain groups are holding their positions for longer periods.
This can help distinguish between what people are saying about the market and what their on-chain behavior may suggest.
That does not mean blockchain activity reveals someone’s intentions with certainty. Blockchain addresses are pseudonymous, and the reason behind a transaction is often unknown.
The value comes from identifying patterns across many transactions rather than interpreting a single wallet movement.
Using Blockchain Data With Technical Analysis
Blockchain data becomes more powerful when it is combined with other forms of market analysis.
Consider a simple scenario.
Bitcoin breaks above a major resistance level.
A trader could stop at the price chart and interpret the move as a bullish breakout.
A broader analysis might ask:
Is trading volume supporting the breakout?Are exchange balances changing?Are large holders accumulating or distributing?Is network activity increasing?Is derivatives positioning becoming excessively leveraged?Is the broader market also strengthening?
The answers do not guarantee a correct prediction. They simply provide additional context.
This is one of the biggest advantages of blockchain analysis: it can help traders move beyond a single data point.
Blockchain Data Can Help With Risk Management
Trading decisions are not only about finding opportunities.
They are also about knowing when an opportunity may carry more risk than it appears.
Blockchain metrics can contribute to risk analysis by highlighting unusual activity.
For example, a trader might become more cautious when several conditions appear simultaneously:
Rapid price increase + heavy leverage + large exchange inflows + increased whale activity
None of these signals alone proves that a correction is coming.
Together, however, they may justify reducing position size, tightening risk controls, or waiting for additional confirmation.
This is a more practical way to use blockchain data. Instead of asking, “Does this metric say buy or sell?”, traders can ask, “What does this information change about my risk?”
The Limitations of Blockchain Data
Blockchain data is powerful, but it is not a crystal ball.
One of the biggest mistakes beginners make is assuming that every on-chain metric has a straightforward interpretation.
It doesn’t.
A wallet moving coins to an exchange does not necessarily mean those coins will be sold. An increase in active addresses does not necessarily mean more individual investors are entering the market. A whale transaction does not automatically indicate bullish or bearish intent.
There is also the issue of data quality and interpretation. Raw blockchain data can be complex, and different methodologies for grouping addresses or calculating metrics can produce different results. Point-in-time data and careful methodology are particularly important when researchers backtest strategies to avoid look-ahead bias.
This makes context essential.
A Better Way to Use Blockchain Data
Instead of building an entire trading strategy around one metric, traders can create a simple framework.
Start with the market
Look at price, volume, volatility, and market structure first.
Add blockchain activity
Check whether network usage, transaction activity, and capital flows support what the price is showing.
Examine participant behavior
Look at exchange flows, whale activity, holder behavior, and supply distribution.
Compare different timeframes
A short-term spike may mean something completely different from a trend that has continued for several weeks.
Look for confirmation
The strongest conclusions usually come from several independent pieces of evidence pointing in the same direction.
Manage the downside
Even when blockchain data appears favorable, no signal guarantees a profitable trade. Position sizing, stop-loss planning, and risk management remain essential.
The Future of Data-Driven Crypto Trading
As cryptocurrency markets become more sophisticated, traders are increasingly working with multiple layers of information rather than relying on price alone.
Blockchain data is becoming one of those layers.
Modern analytics platforms can combine on-chain information with spot markets, derivatives, order books, macroeconomic data, and other sources to create a broader view of market conditions.
This creates an important shift in how traders approach research.
The question is no longer simply:
“Where is the price going?”
It becomes:
“What is happening across the market, and does the available evidence support the trade?”
That distinction can lead to better decision-making.
Final Thoughts
Blockchain data gives crypto traders something unique: visibility into the activity happening directly on public networks.
Transactions, wallet movements, exchange flows, network activity, supply distribution, and holder behavior can all provide useful clues about market conditions.
But blockchain data works best as evidence, not prediction.
The most effective approach is to combine on-chain analysis with technical indicators, derivatives data, market structure, fundamental research, and disciplined risk management.
In a market where narratives can change within minutes, having more context can be just as valuable as having a faster chart.
The Role of Blockchain Data in Trading Decisions was originally published in Coinmonks on Medium, where people are continuing the conversation by highlighting and responding to this story.