
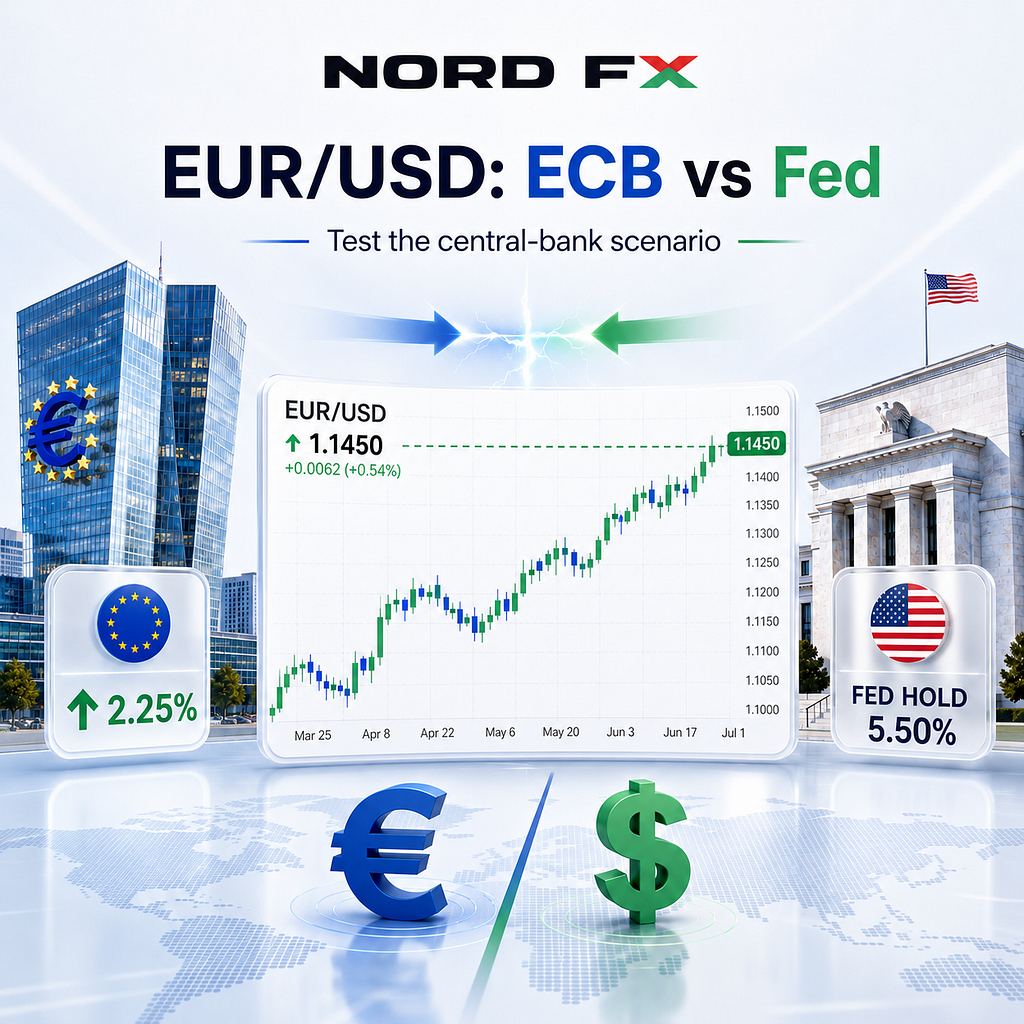
The euro just hit its strongest level in a month, trading near $1.145 🚀 And the reason is a genuine central-bank standoff few traders get to watch play out live.
🇪🇺 On June 11 the ECB hiked rates for the first time in three years, taking the deposit rate to 2.25%, driven by an energy-price shock from Middle East tensions. Its next decision lands July 23, but the real test is September, where markets are now pricing in a further hike.
🇺🇸 On June 17 the Fed held rates steady and dropped its easing bias. Then June inflation data came in unexpectedly soft, cooling bets on any further Fed tightening and pulling the dollar lower.
Two central banks, two opposite signals, one pair caught in the middle 🌍 That’s not a chart pattern, that’s a live experiment in monetary policy.
So here’s the real question: what happens to EUR/USD if the ECB hikes again in September while the Fed stays on hold? Open the chart, mark $1.145 as your reference point, and test the scenario yourself 📈
Ready to trade the story as it unfolds? Register with NordFX and start testing your own central-bank scenarios on a live EUR/USD chart 👇
🔗 https://my.nordfx.com/en/registration?utm_source=social&utm_medium=post&utm_campaign=nordfx
📊 NordFX: Register, Open the EUR/USD Chart and Test a Central-Bank Scenario was originally published in Coinmonks on Medium, where people are continuing the conversation by highlighting and responding to this story.