
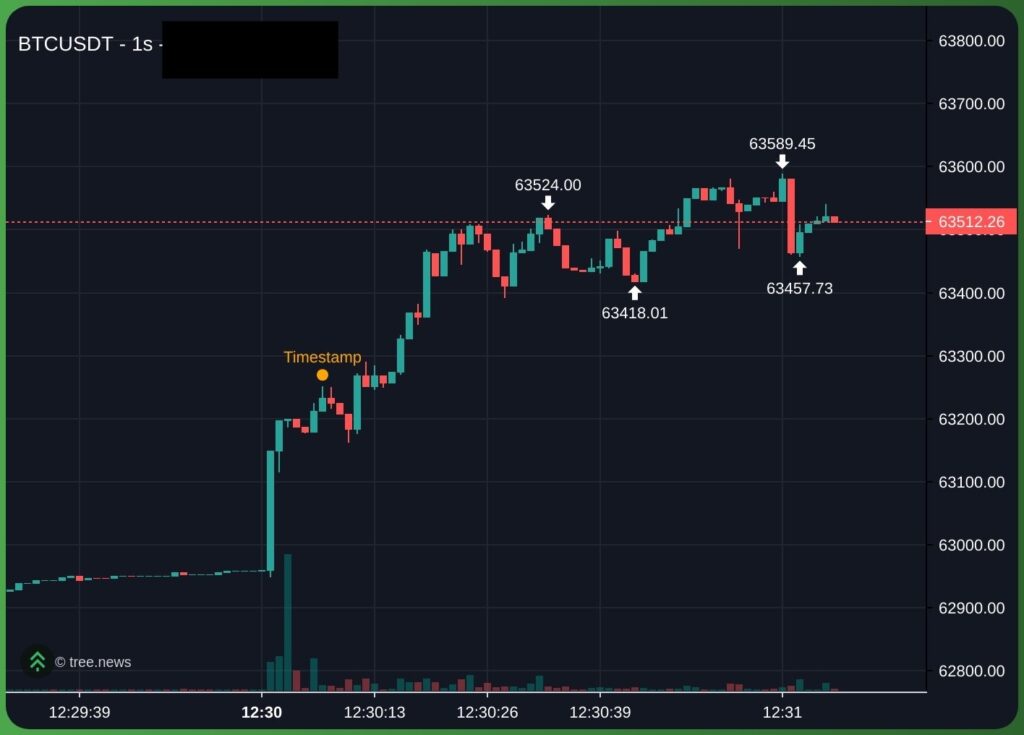
The softest US inflation print since 2020 drove bitcoin to a $65,086 close on Tuesday, up 4.4 percent and its highest level since 22 June. A repricing of macroeconomic expectations powered the move. Spot Exchange Traded Funds (ETF) had shed $424.7 million on 13 July, reversing the gains of the prior week, itself the first period of net inflows after nine consecutive weeks of outflows. Helpfully, Strategy’s 8-K filing is indicating no change in bitcoin holdings, with its corporate obligations covered through a recent $466.7 million equity offering. Funding rates however are rising, and demand for options protection has deepened alongside the BTC price move, even despite an inflow into BTC ETFs of $181.1 million yesterday, 14 July, 2026.
In addition, the Short-Term Holder cost basis has decayed to $68,073, converging with the $68,266 Q2 open into what has become a single decision band, sitting within five percent of the spot price. Changed macro conditions have fuelled the move up, but we need to see the price at $68,000, and driven by sustained ETF inflows to see if the market keeps at these levels.
Our view is that most of the rally so far is attributed to the shift in macro conditions this week. The soft Consumer Price Index (CPI) print collapsed July hike odds from 42 percent to 12.3 percent, the two-year US treasury note fell 14 basis points, and BTC repriced higher, alongside other risk assets including equities.
We had not seen any Bitcoin-specific demand before the inflation print: the ETF complex sold $424.7 million on 13 July, Strategy bought nothing, and the Coinbase premium is still negative. The $181 million of inflows seen on 14 July are now the test. It was driven by the CPI print. Whether this is sustained will be seen in future flows, but right now we remain cautious. The asymmetric strength that BTC saw last week was undone by a single day of heavy outflows on 13 July and price retested the lower timeframe range lows again closing 2.26 percent lower. All risk assets had suffered on Monday but BTC suffered much more than equities.
A rally built on a macro catalyst, with limited spot absorption and no price-agnostic bid, that had been a constant in previous uptrends for BTC, is ‘borrowed strength’ that the lender can call back. If the rates story reverses, with Brent moving through $90 re-arming September hike pricing and dating the CPI print at once, the justification for the move disappears, because not much else is holding the price up. A rally financed by constant and price-agnostic ETF inflows keeps its gains when the news cycle turns; a rally financed by one data print does not.
What the CPI Actually Repriced
The June CPI was the first downside inflation surprise of 2026. Headline CPI fell 0.4 percent month on month, the largest monthly decline since April 2020, taking the annual rate from 4.2 percent to 3.5 percent against a 3.8 percent consensus. Core prices were flat on the month, with the annual rate at 2.6 percent against an expected 2.9 percent. The driver was a 5.7 percent collapse in the energy index, itself the deepest since April 2020. Market-implied odds of a July rate hike collapsed from 42 percent on Monday to roughly 12.3 percent after the print, the two-year yield fell as much as 14 basis points to 4.14 percent, its largest one-day decline since February, and the dollar index slipped toward 100.9 before a partial rebound on Chair Warsh’s pushback. Equity indices are within 50-100 basis points of their current ATHs despite the recent turmoil.
Strategy Stands Down
The seller the market spent last week absorbing did not come back for a second draw. Monday’s 8-K filing, covering 6 to 12 July, showed Strategy bought no bitcoin, and more to the point, sold none. Aggregate holdings were unchanged at 843,775 BTC at a $75,476 average. Corporate obligations were covered via the equity market, where a 4.8 million share offering netted $466.7 million, bolstering Strategy’s USD Reserve to $3.0 billion. This cash amount is enough to cover several years of interest and dividend payments. With that in mind, last week’s record 3,588 BTC sale appears to be an isolated event rather than a sustained liquidation trend, leaving the majority of the $1.25 billion authorisation unused.
The trade-off moved to the equity price of MSTR, which is still trading below its bitcoin Net Asset Value (NAV). Every ATM sale is dilutive on a BTC-per-share basis, a premium paid to remove forced spot selling off the table. The market approved. MSTR rose 5.9 percent on CPI day to $97.58, and STRC closed Tuesday at $88.21, just under 12 percent below its $100 par and well off the sub-$75 lows printed at the start of the month.
Options Hedge Down
Options traders are actually hedging into the move higher rather than building positions. The 25-delta skew has puts trading five to seven volatility points over calls across all of the important expiries. This implies that traders are once again willing to pay a premium for downside protection rather than speculative bid. The protection bid deepened through a 4.4 percent rally: participants are renting the upside and paying up to insure the downside. Dealers remain below the gamma flip we last verified near $68,000 in late June (the level re-forms with each expiry but we are still within neutral-to-negative gamma territory implying dealer hedging will amplify moves in either direction). This keeps the tape in its amplifying regime: whatever happens at the $68,000 resistance band with multiple confluences, the dealer flow will exaggerate it.
Critical Metrics To Watch
MetricStatus at $64,700Bullish SignalBearish SignalETF Flows-$424.7m Monday wiped the green weekFresh net-inflow week, IBIT ledThree straight red sessionsStrategyNo BTC sold; equity-funded reserveProgramme stays idleSecond 8-K drawSTRC Parity$88, ~12% below parGrind toward $100New lows under $82Funding~10% APR, risingHolds under 15% on strengthAbove 15-20% into $68kOptions SkewPuts +6.5 vol pts (30d)Skew flattens toward meanPut premium past 8 ptsCost BasisSTHRP $68,073 meets $68,266 openAcceptance above $68,300Rejection at the bandDemand Shelf$61,360-$61,778, four tests heldHolds any fifth testTwo closes below $61,300US Spot BidCoinbase premium negative since 19 MayFirst sustained positive printStreak extends through rally
What We Are Watching
The ETF Flows Streak. Any flows that we see from today, 15 July 2026, and following will decide whether 13 July outflow was a one-day fade, or if the flows seen on 14 July mark the onset of a strong inflow streak or not. A demand complex that cannot buy the year’s best macro print will be an invalidation for our bullish July thesis. For now, Tuesday 14 July saw $181.1 million of net inflows led primarily by IBIT at $138.9 million, whether this streak can follow through will be key.
The $68,000 to $68,300 band. Acceptance above it is the standing confirmation trigger. A rejection there, with funding pushing through 15 percent and the put bid still elevated, is the cleanest bearish retest on mid-timeframes leading us to believe that the range will continue to hold and potentially even break below the $58k lows.
Oil against the front end. Brent through $90 re-arms September hike pricing and formally dates the CPI print. The borrowed bid gets called in the rates market first, not the crypto one.
Strategy’s next 8-K. An idle programme keeps the absorbed seller priced. A second draw reopens the question of whether there is enough absorption demand to keep prices stable.
The demand band. Two daily closes below $61,300 (range lows before the macro reprieve from CPI) invalidates the constructive read and reopens $58,532, then the $52,903 realised-price floor.
The post The Borrowed Bid appeared first on Bitfinex blog.