
Three years ago, before I got sober, I parked a stop-loss right inside the densest liquidation cluster on the board. I watched the wick stab down, vaporize my stop, and reverse to my original target without me. I had front-run my own funeral.
That trade cost me more than money. It was one of the last dominoes before I blew up the account for good. But it also taught me the single most useful thing I know about derivatives: the crowd’s pain points are printed on the chart, in advance, if you know where to look.
That is what this guide is about. I am going to show you how to trade liquidation clusters on Hyperliquid using real, repeatable setups across BTC, ETH, and SOL. Not theory. Not “liquidations are when leverage goes bad.” Actual entries, stops, and targets, plus the mistakes that nearly ended my trading career.
Quick answer: A liquidation cluster is a price level where a large number of leveraged positions get force-closed at the same time. On Hyperliquid you can see these clusters forming on a liquidation heatmap before they trigger. You trade them by fading the sweep into a dense cluster, riding the cascade through thin zones, and never resting a stop inside one.
Hyperliquid Liquidation Heatmap – Live Liquidation Clusters
Let me build it from the ground up. Skip ahead if you already know the mechanics.
What a liquidation cluster is on the Hyperliquid heatmap
A liquidation happens when a leveraged position can no longer cover its losses. The exchange force-closes it to protect the system. The price where that happens is the position’s liquidation price.
Now stack thousands of traders together. A lot of them open positions near the same support, at the same round numbers, at similar leverage. Their liquidation prices bunch up. That bunch is a liquidation cluster, and on a Hyperliquid liquidation heatmap it shows up as a bright band at a predictable price.
Hyperliquid is a clean place to study this for one reason: it is on-chain. The positions are real and visible, not a centralized exchange’s best guess. The protocol liquidates against the mark price (a smoothed oracle price), not the last trade, so wicks on a single venue cannot nuke you the way they can elsewhere. Once your margin falls below the maintenance margin requirement, you are gone, and a backstop liquidator (often the HLP vault) takes the position.
Leverage caps shape where clusters form. BTC allows up to 40x. SOL sits lower, usually in the 20x to 25x range. Higher caps mean traders pile in tighter to the current price, so BTC clusters often sit closer to spot than SOL clusters do. Hold that thought, because it matters when we compare assets.
How to read the Hyperliquid liquidation heatmap
view live liq clusters at https://hyperperps.app/hyperliquid-liquidation-clusters
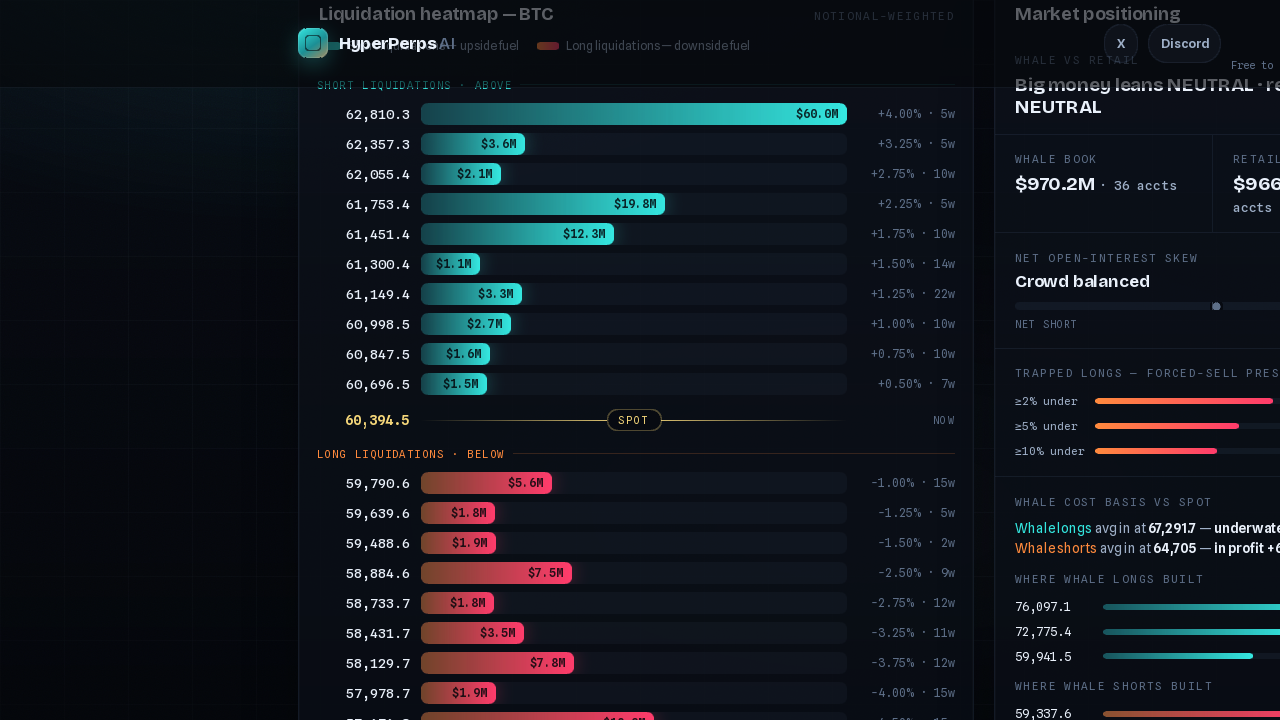
The live BTC liquidation heatmap on HyperPerps. Teal bars above spot are short-liquidation clusters (upside fuel). Red bars below are long-liquidation clusters (downside fuel). Wider and brighter equals more leveraged size waiting at that price.
A liquidation heatmap is just a map of where those clusters sit. Price runs up the side. Time runs across. The bright bands are where the leverage is stacked.
Here is the mental model I use:
Brightness equals size. A bright, thick band is a fat cluster (lots of size, lots of forced orders waiting). A faint band is thin.Color equals side. Most tools color long liquidations and short liquidations differently. Longs get liquidated below price. Shorts get liquidated above it.Clusters act like magnets. Price drifts toward dense liquidity because that is where the resting orders and forced fills live. Market makers know it too.
(If you are following along, pull up the live BTC, ETH, and SOL heatmap I link near the bottom and keep it open. Reading this with a static screenshot is like learning to swim from a textbook.)
The skill is not spotting the brightest band. Everyone sees that. The skill is reading which clusters are fresh and unfilled versus already swept. A cluster that price has already pierced is spent. A cluster sitting just out of reach, glowing, untouched, is a loaded spring.
Why clusters move price: the cascade
A single liquidation is a market order the trader did not choose to send. When a long gets liquidated, the system sells. That selling pushes price down. Lower price triggers the next liquidation cluster. More forced selling. Lower price. You see where this goes.
That feedback loop is a liquidation cascade, and it is why clusters are not just lines on a chart. They are fuel.
Hyperliquid adds its own wrinkle. Liquidations get processed in chunks rather than all at once, with the backstop vault absorbing size in steps. That can make a cascade look stair-stepped instead of a single vertical candle. For us, that stair-stepping is a gift, because it gives you time to react instead of waking up already stopped out.
Cascades feel violent and random in the moment. They are not. They are a chain reaction with a visible fuse. The heatmap is the fuse.
Price with the liquidation overlay on. You can watch candles get pulled toward the dense clusters in real time, then accelerate through the thin zones between them.
BTC vs ETH vs SOL: how their clusters behave differently
This is the part almost nobody writes about, and it is where the edge lives. The three majors do not behave the same, and trading them like they do is how you get chopped up.
Here is what I have found after staring at these books longer than is healthy.
BTC clusters are deep and slow. Bitcoin has the most open interest and the deepest liquidity on Hyperliquid. Its clusters act like strong magnets, but price tends to grind into them rather than rocket. A BTC cluster sweep often gives you time to position. Fades work well here because reversals off BTC clusters are usually orderly. The risk is that a truly big cluster can absorb a lot before it breaks.
SOL clusters are shallow and violent. Solana runs lower max leverage but far higher relative volatility and thinner liquidity. When a SOL cluster goes, it goes. Cascades resolve fast and overshoot. The fade still works, but your stop has to respect that SOL can spike three percent past a cluster before snapping back. Size down. SOL is where I have been right on direction and still liquidated on timing.
ETH sits in the middle. Ethereum behaves like a calmer Solana or a twitchier Bitcoin, depending on the week. Its clusters are meaningful, its cascades have real follow-through, but it rarely overshoots as savagely as SOL. ETH is the asset I send to people learning this, because the signals are clear enough to read and forgiving enough to survive.
The practical takeaway: the same setup needs different stops and different size on each asset. A stop that is sane on BTC is suicide on SOL.
Three ways to actually trade liquidation clusters
Enough background. Here are the three setups I actually use. Each one has an entry, a stop, and a target, because a setup without all three is just a vibe.
The cluster-sweep fade
This is the bread and butter. Price runs into a dense cluster, triggers the forced orders, overshoots, and snaps back. You are fading the overshoot.
Entry: Wait for price to wick into the cluster and show rejection (a long lower wick on a down-sweep, a long upper wick on an up-sweep). Do not enter as price is approaching. Enter on the reaction.Stop: Just beyond the far edge of the cluster, where the thesis is dead. If price closes through the whole cluster, the magnet became a trapdoor. You are wrong. Get out.Target: The next resting cluster or obvious liquidity in the opposite direction. Clusters point at clusters.
The fade works because most of the forced selling (or buying) is exhausted right after the sweep. The crowd that was going to get liquidated already did. Supply dries up. Price reverts.
The cascade chase
The mirror image. Instead of fading the cluster, you ride the chain reaction between clusters.
Entry: When price breaks cleanly through a cluster on rising volume and there is a thin zone above or below before the next dense band, you go with the move. Empty space on the heatmap means little resistance.Stop: Back inside the cluster you just broke, because if price reclaims it, the breakout failed.Target: The next dense cluster. That is where the cascade refuels and stalls. Take profit into it, do not wait for it to break too.
This is higher risk and higher reward. You are trading momentum, not reversion. I keep size smaller here and I am quick to take the meat of the move.
Stop placement: never park inside a cluster
This one is not a setup. It is a rule written in my own blood (and margin).
Whatever you trade, your stop cannot live inside a liquidation cluster. That is the first place price gets dragged. Put your stop where my younger self put his, in the brightest band on the board, and you are volunteering to be the liquidity that fills everyone else’s fade.
Place stops beyond clusters, not inside them. Give the magnet room to do its work and then invalidate you cleanly on the other side.
Funding rate plus cluster confluence
A cluster tells you where. Funding tells you who.
When funding rates are heavily positive, longs are paying shorts, which means the book is crowded long, which means the painful move is down, into the long liquidation clusters below. Heavily negative funding flips it: crowded shorts, and the squeeze runs up into the short clusters above.
Stack the two signals. A fat long-liquidation cluster sitting below price plus stretched positive funding is the highest-conviction fade-the-bounce-or-ride-the-flush setup on the board. The crowd is offside and the fuel is loaded under them.
I also glance at open interest. Rising OI into a cluster means new leveraged money is feeding the fire. Falling OI means positions are already closing and the cluster may fizzle. Cluster plus funding plus OI is the three-legged stool. Two legs is a coin flip. Three is an edge.
Position sizing against cluster density
People ask me how much to size around clusters. Here is the rule of thumb I actually use.
The closer and denser the nearest opposing cluster, the smaller your size, because the odds of a violent sweep through your level go up. The farther and thinner the nearest cluster, the more room you have and the more size you can justify.
Practically: if I am long and there is a giant long-liquidation cluster two percent below me, I am trading half size, because that magnet is hungry. If the nearest meaningful cluster is six percent away through thin air, I will carry more. Size is not a fixed number. It is a function of how close the next landmine sits.
And on SOL specifically, cut whatever number you landed on. I mean it.
Retail clusters vs smart-money clusters
Not all clusters are equal. Some are dumb money you can hunt. Some are smart money you should respect.
A retail cluster forms from over-leveraged late entries: a vertical pump, everyone piling in at 20x near the top, a wall of liquidation prices stacked just under the move. These get swept. That is the high-probability fade.
A smart-money cluster is built more deliberately, often lower leverage, often defended. When a cluster keeps getting tested and refuses to break, that is positioning with conviction behind it, not tourists. Fading that is how you get run over.
How do I tell them apart? Cohort positioning and context. Retail clusters appear fast, near local extremes, after emotional moves. Smart clusters build slowly, at structure, and absorb pressure without flushing. When in doubt, watch how the cluster reacts to its first test. The crowd panics. Conviction does not.
Common mistakes I see (and made)
I have made every one of these, so I am not lecturing from a pedestal. I am pointing at the rake I already stepped on.
Chasing every cluster. Most clusters are noise. Trade the fat, fresh, confluent ones. Skip the rest.Stops inside clusters. Covered above. It is the cardinal sin. Do not.Ignoring funding. A cluster without the funding context is half a signal. You are guessing which side breaks.Same size on every asset. SOL is not BTC. Sizing them identically is how you survive ten trades and die on the eleventh.Treating the heatmap as a crystal ball. It is a probability map, not a prophecy. Clusters get defended, cascades fail, and sometimes the magnet just does not pull. Risk-manage like you might be wrong, because regularly you will be.
See it live: the BTC, ETH & SOL heatmap
Everything above is useless on a stale screenshot. Clusters move. You need to watch them load in real time.
I keep the Hyperliquid liquidation heatmap on HyperPerps open while I trade. It polls all of Hyperliquid’s perps and surfaces the large BTC, ETH, and SOL clusters as they build, which is exactly the on-chain, first-party data this whole strategy depends on. Pull it up, find the fattest fresh cluster on BTC right now, and check the funding. That is your first rep.
Trade it on Hyperliquid
If you want to actually run these setups, you need an account on the venue itself. Hyperliquid is the on-chain perps exchange this entire playbook is built around, and it is where the cluster data is real instead of estimated.
You can sign up and trade through our code here: app.hyperliquid.xyz/join/HYPERPERPSBOT. Using the HYPERPERPSBOT referral gets you a fee discount, which matters more than people think when you are trading these setups actively. Fees are the silent tax on every fade.
Frequently asked questions
What is a liquidation cluster on Hyperliquid?
It is a price level where many leveraged positions share the same liquidation price, so they get force-closed together if price reaches it. On Hyperliquid these are visible on-chain, which is why the heatmap data is more trustworthy than a centralized exchange’s estimate.
How should I size my position around nearby liquidation clusters?
Size inversely to cluster proximity and density. If a large opposing cluster sits close to your entry (say within two percent), trade smaller, because a sweep through your level is likely. If the nearest meaningful cluster is far and thin, you can carry more. And always cut size further on high-volatility assets like SOL.
How do I tell a retail cluster from a smart-money cluster?
Retail clusters form fast, near local highs or lows, right after emotional moves, and they get swept. Smart-money clusters build slowly at real structure and absorb repeated tests without flushing. Watch the first test: the crowd panics, conviction holds.
Do liquidation cascades always reverse price?
No. A cascade often overshoots and snaps back, which is the basis of the fade. But cascades can also mark the start of a real trend if there is genuine momentum and rising open interest behind them. That is why you pair the cluster with funding and OI instead of trading it blind.
Is the Hyperliquid heatmap better than CoinGlass?
For Hyperliquid specifically, on-chain data has an edge because the positions are real and verifiable rather than inferred. CoinGlass aggregates across many venues, which is useful for the broad market. For trading Hyperliquid clusters directly, I want the native, on-chain picture.
I rebuilt my account, and my life, on one idea: stop being the liquidity. The traders who get cascaded are not unlucky. They are predictable, and their pain points are printed on the heatmap for anyone willing to read them.
Go pull up the clusters. Find the crowd. Then do not be it.
Nothing here is financial advice. It is one recovered degenerate’s hard-won opinion. Leverage is how I lost everything once. Respect it.
How to Trade the Liquidation Heatmap with Real-Time Data on Hyperliquid was originally published in Coinmonks on Medium, where people are continuing the conversation by highlighting and responding to this story.