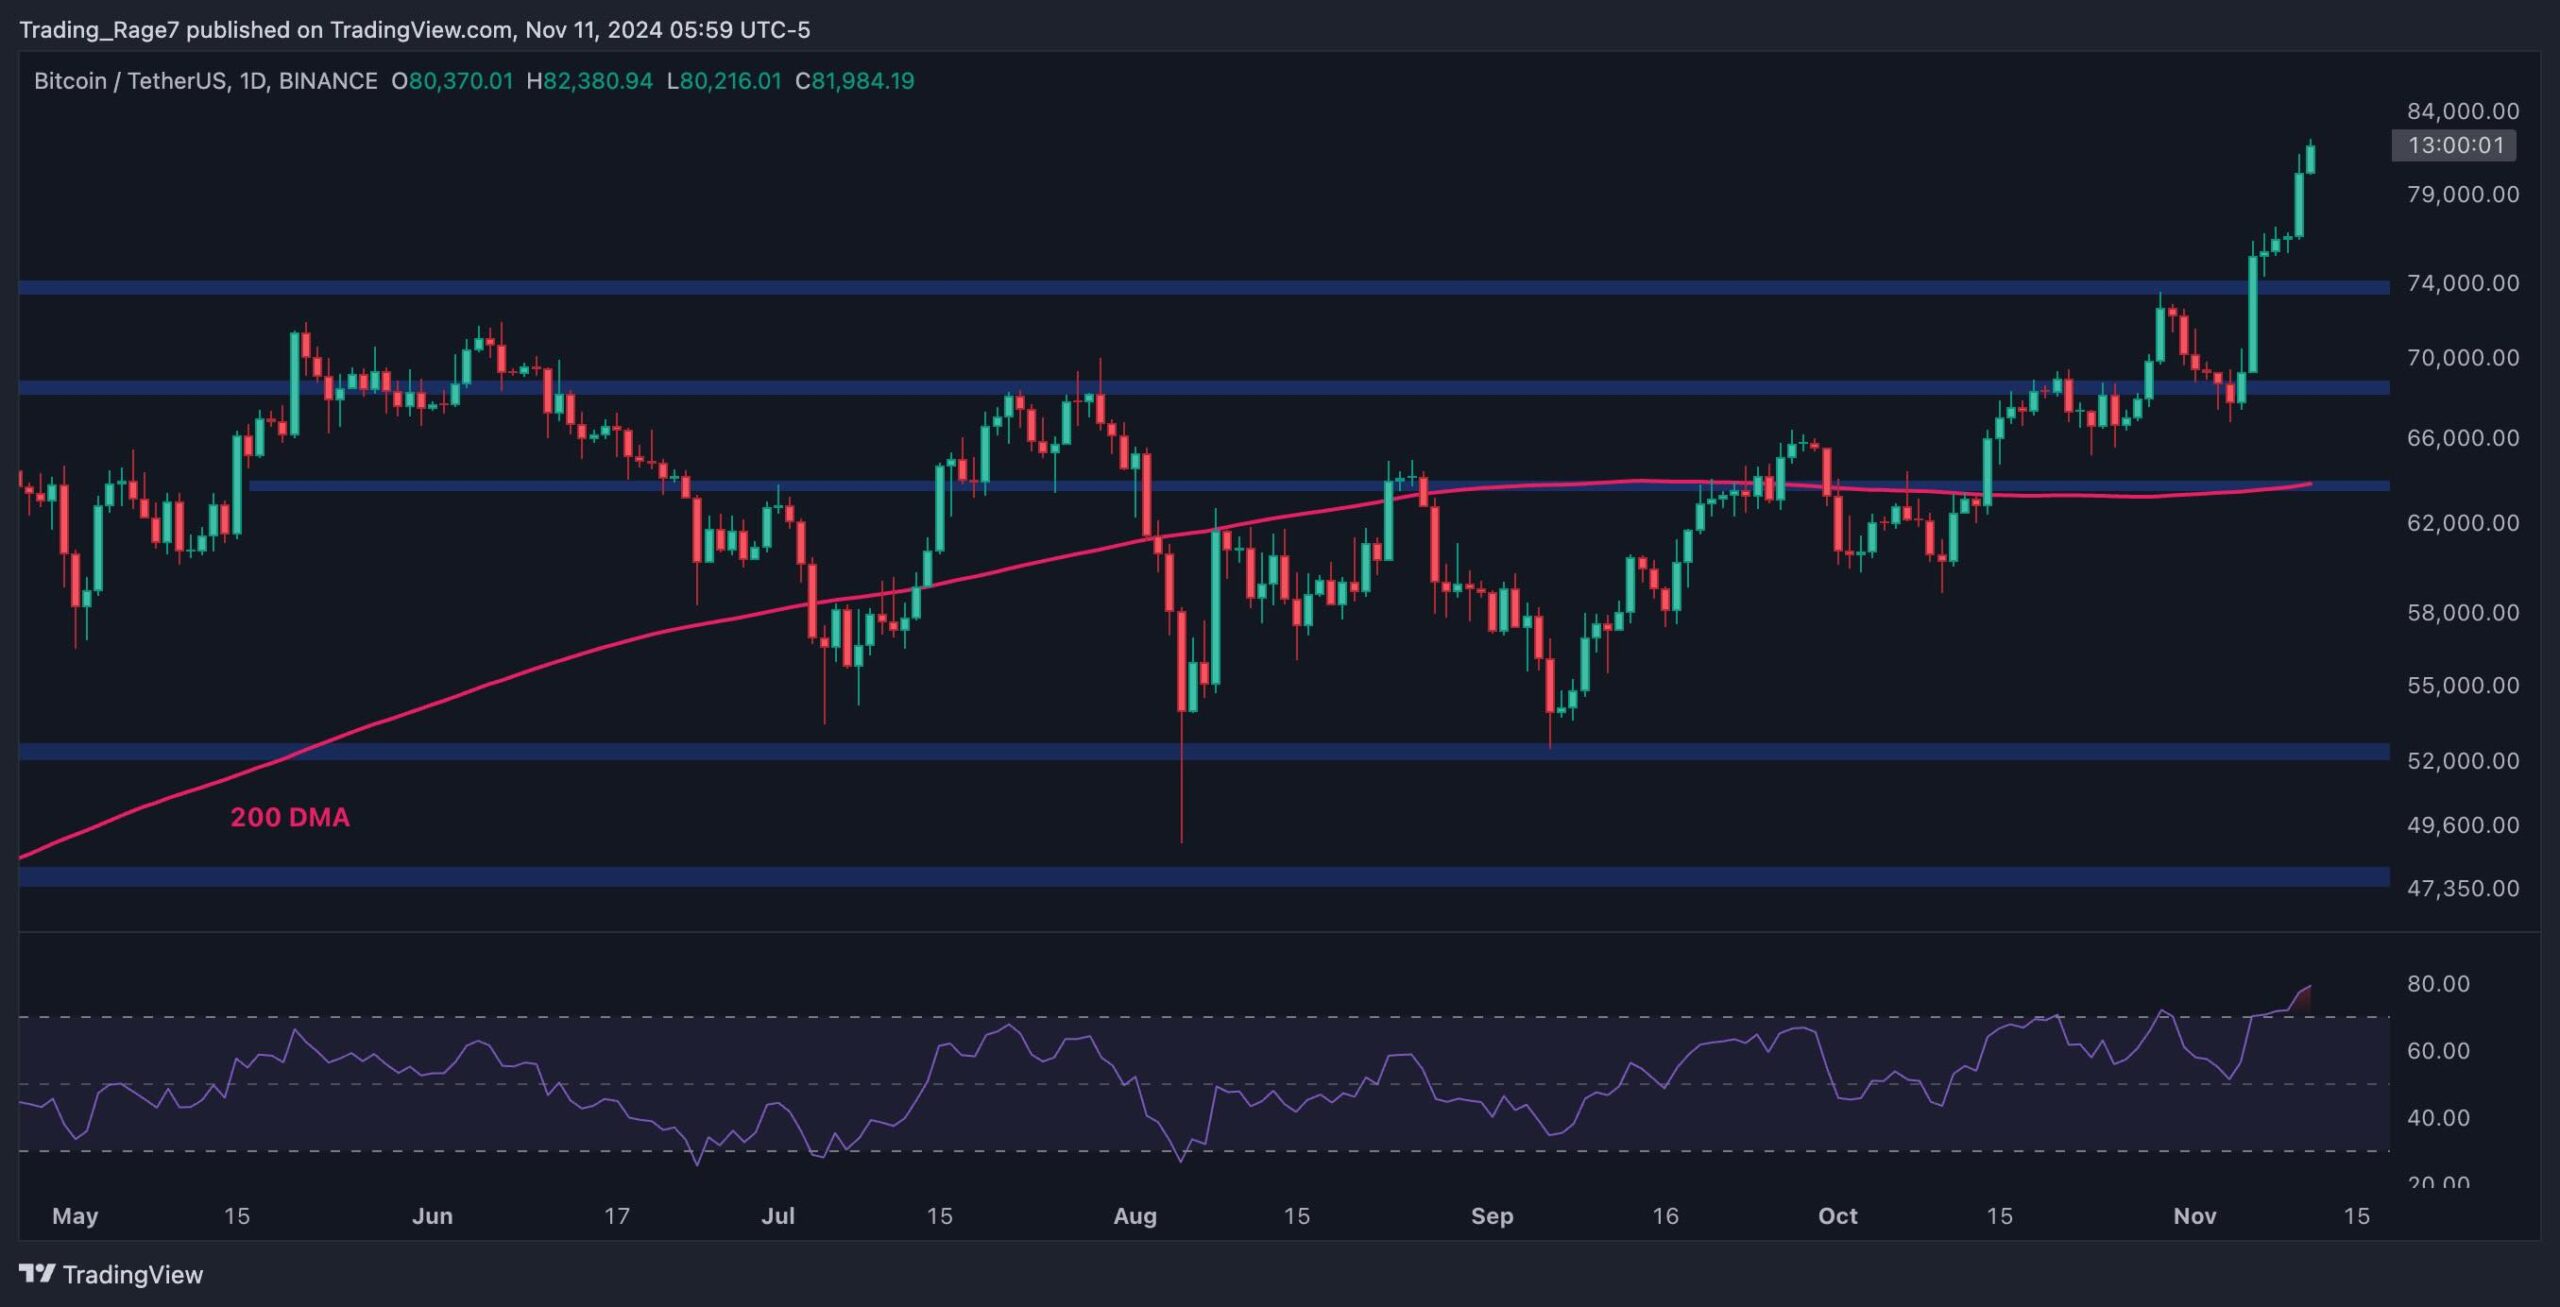
The US election hype might be over, but Bitcoin’s bullish momentum is seemingly here to stay.
The largest cryptocurrency is trading well above $80,000 for the first time in its 15-year history.
Technical Analysis
By Edris Derakhshi (TradingRage)
The Daily Chart
Bitcoin’s price has been making higher highs and lows since its rebound from the $50K area, breaking above multiple resistance levels. Yet, after Trump’s emphatic win in the US election, the asset has begun to rally aggressively, making a new all-time high and even breaking above the $80K level.
Currently, BTC is trading around $82K, and investors are hopeful that the $100K region will be reached soon. Yet, there’s a worrying RSI signal on the daily timeframe, as the momentum is overbought, which could lead to a consolidation or correction in the short term.
The 4-Hour Chart
The 4-hour chart displays a quite similar picture to that of the daily timeframe, as the market has been rapidly climbing higher.
Yet again, the RSI is demonstrating a clear overbought situation. However, considering the overall market structure and the available support levels nearby, even a correction is likely to end by rebounding from the $80K or, eventually, the $74K support area.
On-Chain Analysis
By Edris Derakhshi (TradingRage)
Bitcoin Active Addresses
While Bitcoin is trading at all-time high levels, analysts are concerned that the market might be entering a euphoric state, which could cause a crash. However, this does not necessarily seem true, considering the BTC network activity.
This chart presents the Bitcoin active addresses metric, which shows the number of active wallets in the world’s largest blockchain network. Typically, this value reaches record highs around market tops due to retail traders rushing into the market.
The chart shows that the 100-day moving average of active addresses is around the same values seen during the $15K low at the beginning of the year. Yet, note that while this could point to huge upside potential for the price if this number does not rise quickly, it also shows a massive divergence, which could result in a shortage of demand and make things difficult for the price to continue higher.
The post First Warning Signs Appear for BTC After Surging Past $80K: Bitcoin Price Analysis appeared first on CryptoPotato.
