
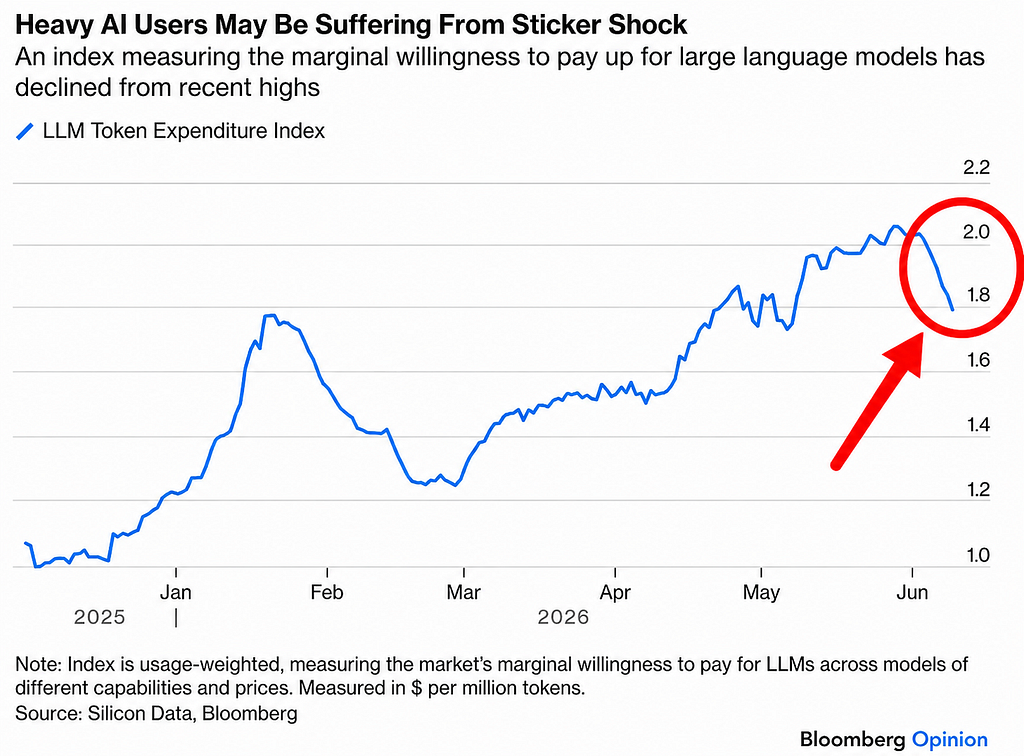
The Most Important AI Index You’ve Never Heard Of
The LLM Token Expenditure Index may tell us more about the AI boom than Nvidia’s stock price ever could.
Everyone is watching the wrong AI chart.
Investors watch Nvidia’s stock price. They watch data-center spending. They watch GPU shipments, electricity demand, and the billions of dollars flowing into artificial intelligence infrastructure.
But those numbers mostly tell us how much money is being spent to build AI.
A much harder question is:
How much is the world actually willing to pay to use it?
That is what a little-known metric called the LLM Token Expenditure Index is trying to measure.
And if the AI boom ever begins to crack, this may be one of the first places we see it.
First, what exactly is a token?
Large language models do not read and write words the way humans do.
They process information in smaller units called tokens.
A token can be a word, part of a word, punctuation, or another fragment of text. When you send a prompt to an AI model, you consume input tokens. When the model answers, it generates output tokens.
This is important because much of the AI economy is ultimately priced around these units.
Developers do not simply pay for “using AI.”
They pay for tokens.
In that sense, tokens are becoming something like the smallest billable unit of machine intelligence.
If electricity is measured in kilowatt-hours and human labor in hours worked, the commercial consumption of AI can increasingly be measured in tokens.
That is where the LLM Token Expenditure Index comes in.
What is the LLM Token Expenditure Index?
The LLM Token Expenditure Index, published by Silicon Data under the Bloomberg ticker SDLLMTK, is a daily benchmark of the effective price the market pays for one million LLM inference tokens.
1.62 USD per million tokens
But the name is slightly misleading.
The index does not measure the total number of tokens used.
It does not measure the total amount of money spent on AI.
And it is not simply an average of the prices listed on model providers’ websites.
A better name would probably be:
The LLM Token Expenditure Price Index.
In simple terms, it asks:
Across the AI models people are actually using, how much is the market effectively paying for one million tokens?
That distinction matters.
Imagine an AI market with only two models:
Model A costs $10 per million tokens.Model B costs $1 per million tokens.A simple average would say the average token price is $5.50.
But what if 90% of actual usage goes to the $1 model?
Then $5.50 would tell us almost nothing about the real market.
The LLM Token Expenditure Index tries to solve this problem by weighting the market according to where inference usage and expenditure are actually concentrated.
It is closer to measuring the effective market price of AI intelligence than simply tracking a price list.
How is the index actually calculated?
This is the most important part.
Silicon Data does not publicly disclose every parameter and proprietary weight used in the final calculation. But it does explain the structure of the methodology.
The company tracks more than 400 models and uses more than 20 models in its daily basket, drawing from more than 20 price and volume sources.
According to Silicon Data, the coverage represents more than 90% of the addressable global LLM inference market.
The process can be understood in five steps.
Step 1: Collect real-world pricing observations
The index gathers data from several parts of the LLM market, including:
frontier API providers,open-weight inference platforms,brokered dedicated instances,and self-hosted reference deployments.This matters because the real cost of AI is not captured by looking at a single API pricing page.
Different companies buy intelligence in different ways.
Step 2: Convert prices into a common unit
Different models have different prices for input and output tokens.
Suppose a model charges:
$2 per million input tokens,$10 per million output tokens.You cannot simply compare it with another model using one of those prices.
The costs first need to be normalized into a comparable blended price.
Conceptually, the calculation looks something like this:
Normalized Token Price = (Input Price × Input Weight) + (Output Price × Output Weight)
If the representative workload were 80% input and 20% output, then:
($2 × 0.8) + ($10 × 0.2) = $3.60 per million tokens
This is only a simplified illustration. Silicon Data also normalizes observations for context window, batching behavior, and reliability.
The point is simple:
A token is not economically identical across every model and every workload.
The index tries to make those different observations comparable.
Step 3: Filter out models that do not represent meaningful market activity
Not every one of the 400-plus tracked models enters the daily index.
Models must show sustained usage and market expenditure.
Statistical outliers are also removed.
The result is a daily basket of more than 20 models representing the part of the market where meaningful inference activity is actually happening.
Step 4: Weight the models by where the market is spending and using AI
This is the key.
A simplified conceptual version of the index would look like this:
LLM Token Expenditure Index = Σ (Normalized Token Priceᵢ × Market Weightᵢ)
where:
Normalized Token Priceᵢ is the comparable effective price of model i,Market Weightᵢ represents where inference usage and expenditure are concentrated,and all market weights add up to 100%.Consider this simplified example:
ModelEffective Price per 1M TokensMarket WeightFrontier Model A$1220%Frontier Model B$630%Efficient Model C$150%
The expenditure-weighted index would be:
($12 × 0.20) + ($6 × 0.30) + ($1 × 0.50) = $4.70
Now imagine users begin moving away from the expensive frontier models and toward the efficient $1 model.
Even if none of the providers changes its official price, the index can fall.
Why?
Because the market is buying a cheaper mix of intelligence.
That is what makes this index so interesting.
It tracks not only price.
It also captures what kind of intelligence the market is willing to pay for.
Step 5: Validate and publish the result
The final observations are normalized, filtered for outliers, independently validated, and published as a daily blended rate in U.S. dollars per million tokens.
The result is the SDLLMTK index.
One number.
A snapshot of what the AI market is effectively paying for machine intelligence.
What makes the index go up?
A rising index does not necessarily mean that every AI company has raised its prices.
The index can rise when:
Users shift toward more expensive frontier models.
If companies increasingly use the most capable models for coding, research, autonomous agents, or complex reasoning, the weighted market price rises.
Model providers gain pricing power.
If customers are willing to pay more for scarce or superior capabilities, the effective price of intelligence rises.
Infrastructure constraints make inference more expensive.
GPU costs, memory bottlenecks, power constraints, and serving inefficiencies can all flow downstream into token economics.
In short:
A rising index can mean the market is willing to pay more for better AI.
That is a powerful demand signal.
What makes the index fall?
This is where things become more complicated.
A falling index does not automatically mean that AI demand is collapsing.
It can fall because:
providers cut prices,users switch to cheaper models,open-weight models gain market share,inference becomes more efficient,workloads are routed to smaller specialized models,or expensive frontier models lose concentration.
Imagine a company using the most powerful model available for every task.
Then its finance team sees the bill.
Suddenly, a cheaper model handles customer support. A small model processes documents. An open-weight model runs repetitive tasks. The frontier model is reserved only for problems that genuinely require it.
AI usage may continue growing.
But the average price the company pays per token falls.
That would push the index down.
This is why the index should not be interpreted as a simple “AI demand chart.”
It measures the price and composition of demand.
Why Wall Street suddenly cares
The AI investment thesis has a giant problem.
The world is spending enormous amounts of money building AI infrastructure today based on expectations about demand tomorrow.
Data centers need GPUs.
GPUs need advanced memory.
Data centers need electricity, cooling, networking equipment, land, and capital.
The entire chain ultimately depends on one question:
Will customers generate enough economic value from AI to keep paying for all of this?
The LLM Token Expenditure Index sits unusually close to that question.
Nvidia revenue tells us how much infrastructure companies are buying.
Hyperscaler capital expenditure tells us how aggressively they are building.
The token market tells us something different:
What are users actually willing to pay to consume the final product?
That is why some investors have begun treating the index as a possible real-time signal for the health of the AI trade.
If companies continue moving toward expensive frontier models, the index can suggest that advanced AI capabilities are creating enough value to justify their cost.
But if users aggressively substitute toward cheaper models, optimize token consumption, or reduce low-return AI experiments, the economics of the boom become more complicated.
The infrastructure can keep growing for a while.
The stocks can keep rising.
The headlines can remain bullish.
But downstream, the market may already be becoming more price-sensitive.
The paradox: AI can get cheaper while the total bill gets bigger
Here is the most important idea in the entire debate.
Price per token and total AI spending are not the same thing.
The basic equation is:
Total AI Inference Spending = Token Price × Token Volume
Suppose the effective price of one million tokens falls by 50%.
That sounds bearish.
But if token consumption rises by 300%, total spending still increases.
This is the AI version of the Jevons paradox: when a resource becomes cheaper and more efficient, people may use so much more of it that total consumption rises rather than falls.
This is why a falling LLM Token Expenditure Index does not automatically mean the AI boom is over.
The crucial question is:
Does token volume grow fast enough to offset the decline in effective token prices?
If yes, cheaper intelligence could create an explosion in AI usage.
If no, falling prices may be telling us that supply is growing faster than economically valuable demand.
That difference could eventually matter enormously for data centers, semiconductor companies, cloud providers, and AI valuations.
Perhaps this is AI’s version of the oil price
Oil investors do not only watch how many drilling rigs are being built.
They watch the price of the commodity being consumed.
The AI industry may be developing something similar.
GPUs are the infrastructure.
Data centers are the refineries.
Tokens are the consumable units.
And the LLM Token Expenditure Index is an early attempt to measure the market price of those units.
The analogy is imperfect, of course. Tokens are not physically scarce barrels of oil. Their economics can change rapidly through software improvements, model competition, hardware advances, and better inference techniques.
But that may make the index even more interesting.
It sits at the intersection of:
AI capability, demand, pricing power, infrastructure cost, and efficiency.
Few other metrics capture all five.
The biggest limitation
The index is still young.
Its detailed proprietary weighting methodology is not fully public.
The LLM market is also changing extraordinarily fast, and tokenization itself is not perfectly standardized across models.
A million tokens on one system may not represent exactly the same amount of useful work as a million tokens on another.
More importantly, cheaper tokens do not necessarily mean worse AI economics.
A company that reduces its AI bill by 80% while producing the same output is not abandoning AI.
It is becoming more efficient.
So the index should never be read alone.
The most useful dashboard would combine:
effective token price + token volume + total inference expenditure
Together, those three numbers could tell us whether the AI economy is:
expanding,commoditizing,becoming more efficient,or genuinely slowing down.
Today, we do not yet have a perfect real-time view of all three.
But the LLM Token Expenditure Index gives us one of the missing pieces.
The chart I will be watching
The AI boom has mostly been measured from the supply side.
How many GPUs were sold?
How many data centers were built?
How much capital was spent?
But eventually, every investment boom has to answer to demand.
Someone has to use the product.
Someone has to pay for it.
And the price they are willing to pay matters.
That is why the LLM Token Expenditure Index may become one of the most important economic indicators of the AI era.
Not because it can tell us exactly where Nvidia’s stock will go tomorrow.
Not because every decline means the AI bubble is bursting.
But because it asks a more fundamental question than most AI charts:
What is the world actually willing to pay for intelligence?
And over the next decade, the answer to that question may be worth trillions of dollars.
The AI Index That Could Predict the End of the AI Boom was originally published in Coinmonks on Medium, where people are continuing the conversation by highlighting and responding to this story.