The largest cryptocurrency by market capitalization has been nosediving lately, with its price posting another substantial decline over the past 24 hours.
Multiple analysts believe the valuation could reach new lows in the near future, while one key indicator suggests a rebound could be on the horizon.
How Much Lower?
There’s no way to soften what’s been happening to BTC lately. Its price has lost over $20,000 in the past month alone, and several hours ago it dipped to nearly $61,000, the lowest point since early February. The reasons behind this carnage are many and various: Strategy’s historic decision to sell some Bitcoin, the escalating conflict in the Middle East, the massive outflows from spot ETFs, and the bear market reigning across the broader crypto market.
Currently, the asset trades at around $62,500, which is a slight comeback, but according to numerous industry participants, the worst is yet to come.
Ali Martinez recently claimed that the plunge below $72,000 has put BTC in “a vulnerable position.” He said that, based on the MVRV Pricing Bands, the next major support is between $50,000 and $54,000.
For his part, X user Ted argued that BTC’s “head-and-shoulders” breakdown target is still not complete. He described $49,000 as “a good bottom zone,” drawing parallels to the August 2024 low.
Somewhat expected, the major collapse of BTC’s price gave Peter Schiff the opportunity to make a highly pessimistic prediction. The well-known crypto critic and outspoken proponent of gold forecasted that the valuation could nosedive to $20,000 if it breaks $50,000.
“It should be a quick fall below $20K, which should be a big enough drop to shake the conviction of long-term HODLers, causing many to finally throw in the towel,” he added.
Light at the End of the Tunnel?
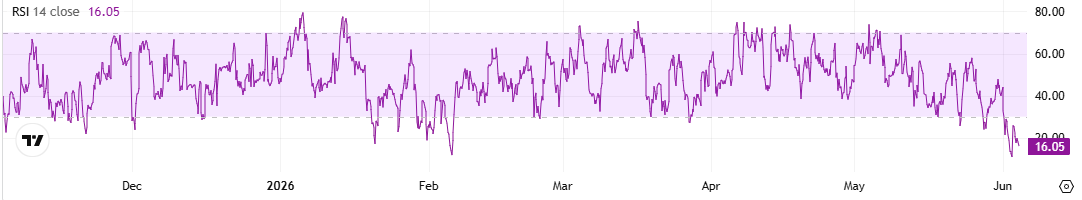
Contrary to the bloodbath and the predictions of a further collapse ahead, BTC’s Relative Strength Index (RSI) suggests it might be time for a resurgence. The technical analysis tool is often used by traders to spot potential price reversal points, as it indicates whether the asset is oversold or overbought.
It runs from 0 to 100, and anything below 30 indicates that the price has fallen too much in a short period of time and could be due for a comeback. On the other hand, readings above 70 signal that a pullback might be on the horizon. Just a few hours ago, the RSI dropped to 11, its lowest level in four months, and has since risen to approximately 16.
The post Top Bitcoin Price Predictions After BTC’s 15% Weekly Collapse appeared first on CryptoPotato.