There’s a particular kind of frustration that comes from being right about a trade setup and still losing money on it.
You identified the level. The zone was clean. You had conviction. And then the market just… didn’t follow through. Or worse — it moved exactly where you expected, but you got shaken out first.
Most traders who experience this blame themselves. Their analysis was wrong. They didn’t time the entry properly. They need a better indicator.
But here’s a more uncomfortable possibility: your analysis of the price level was correct. What you were missing was context about what the market was actually doing beneath the surface at that moment. Two specific data points that are publicly available, technically straightforward to monitor, and almost universally ignored by retail traders.
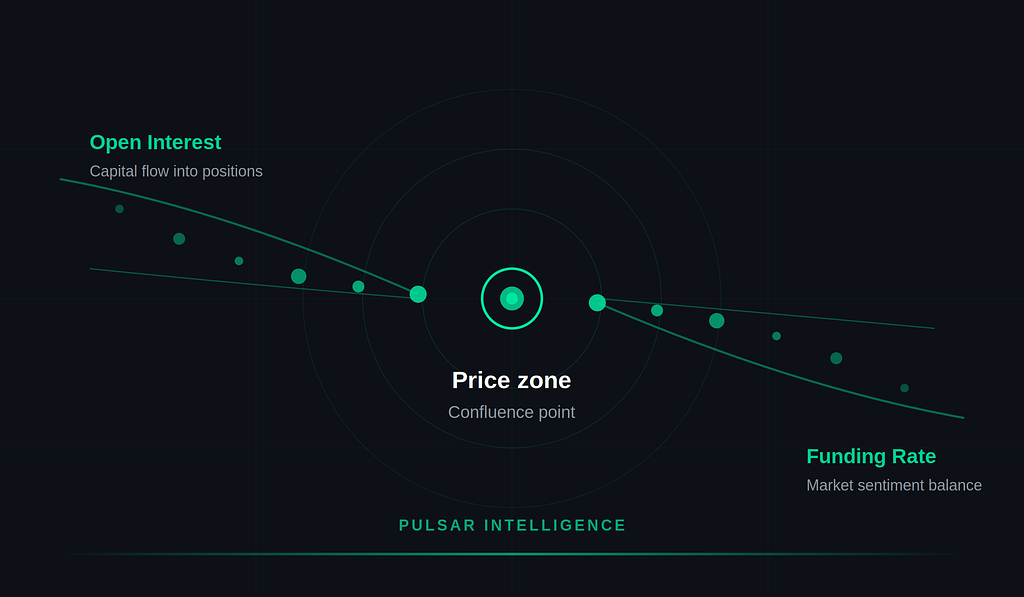
Open Interest and Funding Rate.
What Open Interest Actually Tells You
Open Interest is the total USD value of all currently open futures positions on a given asset across an exchange. It rises when new positions are opened. It falls when positions are closed.
That sounds simple. And it is. But the implications are significant and rarely followed through on properly.
When you see a price zone that looks interesting — a level where serious buying or selling has been documented, a support zone that has held multiple times — the natural question is whether that zone still has conviction behind it right now. Price history tells you where the zone is. Open Interest tells you whether anyone is backing it with fresh capital today.
The relationship is specific:🟢 Accumulation zone firing + OI risingNew money entering the market at this levelTraders opening fresh positions with directional convictionThe zone is being actively defended with capital in real time🔴 Accumulation zone firing + OI fallingExisting positions closing — not new convictionWhat looks like buying pressure may be shorts coveringThe surface looks the same. The underlying story is completely different.
This distinction changes how you read a zone entirely. A zone with rising OI behind it has a fundamentally different probability profile than a zone being defended by closing shorts. Without tracking OI in real time, you cannot tell them apart.
What Funding Rate Actually Tells You
Perpetual futures — the dominant trading instrument across HyperLiquid, Binance, and Bybit — use a funding rate mechanism to keep the perpetual contract price anchored to the spot price. Every eight hours, one side pays the other.
When the funding rate is positive, long position holders pay short position holders. When it is negative, shorts pay longs.
This creates a direct, measurable window into market sentiment that most retail traders glance at but rarely act on systematically.
The funding rate signal — simplified:🔴 Funding strongly positive (+0.10% or above)Market is crowded with longs. Everyone is on the same side.→ Historically precedes corrections as overleveraged longs get squeezed🟢 Funding strongly negative (−0.10% or below)Market is crowded with shorts. Positioned for a collapse that often never comes.→ Historically precedes short squeezes when price rips upward⚪ Funding neutral (between −0.05% and +0.05%)Market is balanced. No extreme crowding on either side.→ Cleanest environment for zone activity to play out
The point is not that extreme funding always predicts a reversal immediately. It is that extreme funding tells you the market is in an unstable state.
Why These Two Signals Are Almost Always Analyzed Separately
If you spend time in trading communities, on fintech research platforms, or following serious on-chain analysts, you will find plenty of content on OI and plenty on funding rates. What you will almost never find is a systematic approach to reading them together — and specifically, correlating both with documented price zone activity in real time.
The reason is practical. Monitoring these signals properly requires connecting to multiple exchange APIs simultaneously — HyperLiquid, Binance, and Bybit each have their own data formats and update cadences. Building the infrastructure to poll funding rates every eight hours, snapshot OI every five minutes, and correlate both against zone activity in real time is non-trivial engineering. Most retail tools don’t do it. Most retail traders don’t have the technical foundation to build it themselves.
So what happens instead is fragmented analysis. A trader checks OI on one tool. Glances at funding on another. Looks at their price zone setup on a chart. Tries to mentally synthesize three separate data streams under time pressure. Unsurprisingly, the synthesis is inconsistent.
What Combined Analysis Actually Looks Like
Consider a concrete scenario. An ETH accumulation zone has been documented at $2,044–$2,068. The same price level has seen significant buying pressure 71 separate times over the past five days. $41.8M in total volume has been absorbed at that zone.
That alone is significant. But what does it mean right now?
If at the moment of the 71st touch, OI on HyperLiquid is rising simultaneously — up 4.2% in the last 30 minutes — new capital is entering the market specifically at this level. The zone is being backed with fresh conviction, not just defended by positions that have been sitting there.
If funding rate across Binance and Bybit is neutral at +0.008%, the trade is not crowded. There is no extreme long overhang waiting to get squeezed.
These three data points together tell a coherent story: an established zone with documented activity, being backed by new capital, in a market that is not yet overcrowded on either side.
That is a fundamentally different setup than the same zone firing with flat OI and a +0.127% funding rate — which would indicate the zone is being tested while leveraged longs are already crowded, raising the probability of a flush before any sustained move.
The price level looks identical in both cases. The underlying market structure is completely different.
A Note on Scoring Confidence
One of the more interesting engineering problems in this space is how to quantify the combined weight of these signals into something actionable.
Zone touch count and absorbed volume establish base confidence. OI direction at the moment of a new zone touch adds or subtracts from that confidence depending on whether new money is entering or leaving. Funding rate state adjusts confidence further — neutral funding increases it, extreme crowding reduces it.
When multiple independent factors align simultaneously — strong zone history, rising OI, neutral funding, appropriate transaction size — the combined signal is meaningfully more reliable than any single factor in isolation. When they conflict — strong zone but falling OI, or rising OI but extreme funding — the signal is more ambiguous and warrants proportionally less confidence.
This kind of multi-factor scoring is standard practice in quantitative trading but almost absent from retail-facing tools, which tend to either present raw data without synthesis or oversimplify to binary buy/sell outputs.
The gap between those two extremes — raw data on one side, oversimplified calls on the other — is where the most interesting intelligence work is happening right now.
The Practical Takeaway
You do not need to act on every OI movement or every funding rate reading. That would generate noise, not signal.
What is worth building into your process is a habit of checking both before deciding whether a zone you are watching actually has conviction behind it at the moment you are considering acting.
Is OI rising or falling at this level right now? Is the market crowded or balanced?
If the zone looks interesting and OI is rising and funding is neutral — you have confluence. Three independent data sources pointing in the same direction.
If the zone looks interesting but funding is extreme and OI is flat — you have a setup that exists on the chart but lacks the underlying market structure to support it cleanly. That is a reason to calibrate your confidence appropriately and size accordingly.
The traders who consistently extract value from market structure are not the ones with better chart patterns or faster entry triggers. They are the ones who understand what the market is actually doing beneath the surface — and who have reliable ways of seeing it.
Pulsar Intelligence monitors OI and funding rates across HyperLiquid, Binance and Bybit in real time — combining both with zone intelligence and a 1–10 confidence score on every observation. pulsarintelligence.ai
OI & Funding Rate: The Two Market Signals Most Crypto Traders Ignore was originally published in Coinmonks on Medium, where people are continuing the conversation by highlighting and responding to this story.