When is the right time to invest in crypto? Should I buy immediately or wait for lower prices? What cryptocurrencies should I buy and how long am I going to hold? I’m sitting on huge losses — should I sell or just hold and hope it will go up again? Should I hold spot or trade futures? These are some of the most common questions beginners ask.
In this article, you are going to learn a simple, beginner-friendly strategy that addresses these questions and helps you understand how to time the crypto market effectively. Many crypto investors prefer to just dollar-cost average into projects they believe in, which is fine, but this guide is for people who want to actually time the market.
Before we begin, please be aware that investing in cryptocurrency can be very profitable but also very risky. Never invest more than you can afford to lose. For complete beginners, it is recommended to start with small amounts in order to safely gain experience. There is no guarantee for success with any strategy.
The Importance of Bitcoin
Bitcoin is the “big daddy” of all cryptocurrencies and as a result, pretty much all altcoins have a strong correlation with Bitcoin. If Bitcoin’s price rises, the prices of most altcoins tend to rise at the same time and if Bitcoin’s price drops, most altcoins follow suit. Individual altcoins can temporarily decorrelate from Bitcoin, often during hype cycles, but long-term decorrelations are very rare. Therefore, understanding Bitcoin’s price movements is crucial, even if the aim is to invest in altcoins.
The Bitcoin Cycle
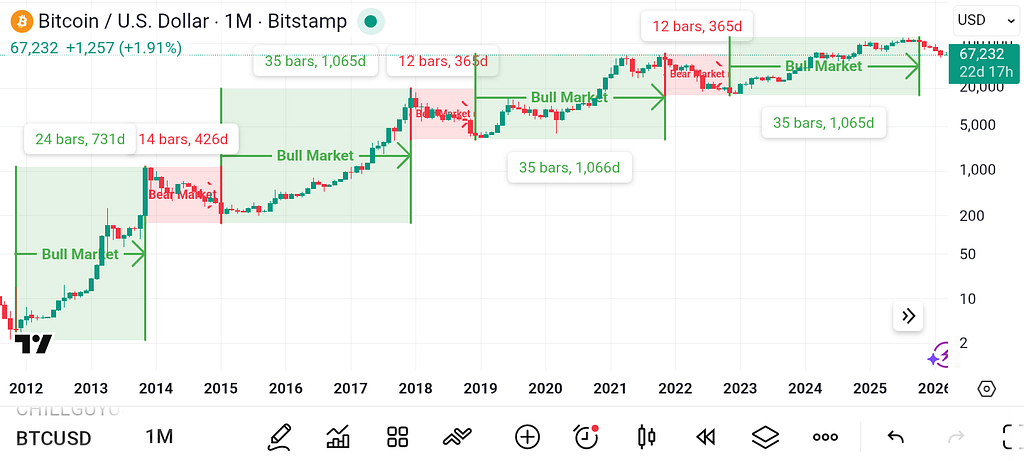
Many readers may have heard about Bitcoin’s four-year cycle. The four-year cycle is a repeating pattern in Bitcoin’s price movement, typically consisting of roughly three years of uptrend or bull market, followed by a one year downtrend or bear market. It has already repeated four times in the past.
Bitcoin cycle overview
To be precise, it’s actually a 3.92-year cycle, because the bull market top for Bitcoin occurs every four years, slightly earlier than in the previous cycle. The last three Bitcoin bull markets lasted precisely 152 weeks, from bear market bottom to bull market top, and the last two Bitcoin bear markets lasted precisely 52 weeks, from bull market top to bear market bottom. The timing is almost too precise to be coincidence.
previous cycles timing
So far, the Bitcoin cycle has been undefeated, and it will therefore serve as our guide moving forward. Now you might object that just because something has happened precisely the same way four times in a row, it doesn’t guarantee it will continue to do so. This objection is entirely justified. We are not going to trust the Bitcoin cycle blindly. Instead, it will be our base case, and we’ll use additional metrics and methods to verify whether it remains valid.
Global M2 Money Supply
An additional metric to consider when analyzing Bitcoin’s chart is the Global M2 money supply. Simply put, it measures the amount of money people and institutions have in their pockets, bank accounts, etc. The more money available, the more can be invested in crypto, ultimately driving prices up. During bull markets, Bitcoin has a lagged correlation to global M2 — meaning M2 rises first, and Bitcoin’s price follows later, after some delay. This delay is usually around 75 days, but this is no exact science. The reason for this lag is that it takes time for the increased money supply to flow into crypto. People may be hesitant at first, take time to do research or invest in traditional assets first, before ultimately turning to crypto.
Bitcoin’s lagged correlation to global M2 gives us a big advantage during bull markets. Since we know whether M2 has recently increased or decreased, we can expect Bitcoin to follow it’s movements in the near future. However, once a bull market ends, Bitcoin’s price usually decorrelates from M2. During bear markets, Bitcoin’s price is driven more by bearish narratives and the inevitability of a market correction after a prolonged rally. This decorrelation can provide additional confirmation of whether Bitcoin truly is in a bear market.
To track global M2, we’ll use a publicly available indicator on TradingView. While there are many similar indicators available, the one I prefer to use is called “M2 Money Shift for Bitcoin”.
Alternatively the indicator “Global Liquidity Index” is also completely fine.
Once we open the indicator, we’ll see the global M2 money supply as a blue or yellow line overlaid on the chart. We’ll use this indicator only on a weekly timeframe, but it can also be applied to a daily chart. Next, we want to enable an offset in the indicator’s settings. An offset shifts this line by a set number of bars into the future, allowing us to clearly see its lagged correlation with Bitcoin. On a weekly chart, the offset should be set to 11 bars and on a daily chart to 75 bars.
The line will now extend into the future where no bars have yet printed on the chart, giving us a rough forecast of what price may do in the weeks ahead during bull market times.
Looking at the past two cycles clearly shows the lagged correlation between Bitcoin and global M2. It also reveals that the correlation always ended with the conclusion of a bull market, meaning that global M2 can continue to rise and yet Bitcoin crashes, once a bull market ends. During bull markets, there have only been two significant short-term decorrelations: one was the COVID dip in 2020, and the other was caused by rumors about the approval of spot Bitcoin ETFs in late 2023, which caused price to rally earlier than expected.
If we look closely at June to September 2025, we can also see that price began to struggle to keep up with the lagged global M2, as it already started to decorrelate slightly before the end of the bull market. This was a crucial sign — a hint that the bull market was coming to an end and was unlikely to be an extended cycle, as many popular influencers were advocating at the time.
Don’t Get Distracted by the News
In crypto, we make money by buying when prices are low and selling when prices are high. The problem with the news is that it tends to be the most positive when prices are already high, and the worst when prices are low. As a result, traders who base their decisions on the news often end up buying high and selling low — the exact opposite of what we’re supposed to do as traders. While real-world events surely do affect the market, the news doesn’t really provide insight into the timing in which these events are finally going to impact prices. For example, a positive news event may benefit price in the long term, perhaps in a year from now, but it can also lead to a quick sell-off in the short term, as investors may expect an immediate rally but get disappointed instead. This phenomenon is called a “sell the news” event.
Financial markets are largely driven by market makers — incredibly wealthy people who manage such large amounts of money that they can actually move prices just by buying and selling. Since they control vast wealth, they also wield significant power, often being the ones who make the decisions. They are often ahead of the news, knowing what’s coming before it even hits the headlines. Some people even speculate that they control the news and use it to manipulate us retail investors into buying high and selling low, allowing them to make more profit on our cost. However, there is a way for us to track every move these market makers make in real time — by looking at the charts. Observing repeating patterns in the charts while ignoring the news gives us a real edge in this market.
Now that we know what not to do, let’s focus on what to do.
Our Buy and Sell Strategy
The first step is to identify where we are in the cycle. If Bitcoin has come from a prolonged downtrend lasting roughly a year and is now in an uptrend that has lasted less than three years so far, we are in a bull market. If Bitcoin has come from an all-time high after a prolonged uptrend lasting about three years and is now in a downtrend that has lasted less than a year so far, we are in a bear market. This is our base case.
Next, we’ll look at global M2. If our base case is a bull market and price shows a strong correlation with the lagged M2 metric we discussed earlier, our bull market thesis is confirmed. If our base case is a bear market and price is trending down, regardless of what the lagged M2 metric is doing, our bear market thesis is confirmed.
Another indicator that can help us determine whether we’re in a bull or bear market is the 50-period exponential moving average on the weekly timeframe. During a bull market, price typically trades above this moving average; during a bear market, it trades below. It’s important to note, however, that this is a lagging indicator — in early bear market, price is still above this moving average and in early bull market, it’s still below.
As of April 2026, Bitcoin has been in a strong downtrend for six months already, after a bull market that lasted exactly 152 weeks. At the same time, price has largely decorrelated from our lagged M2 metric, which has been trending upward throughout this period. This provides further confirmation of our bear market thesis.
If we now want to challenge the Bitcoin cycle and, for example, propose a shortened bear market, we need confirmation for that thesis. Confirmation could come if price were to strongly correlate with the lagged M2 metric again and break above its 50-week exponential moving average before the one-year bear market has played out. That would be a strong indication that this time is indeed different. As long as that doesn’t happen, our base case remains the typical Bitcoin cycle, suggesting that Bitcoin will likely find its bottom somewhere around early October of 2026. Keep in mind that, as traders, we don’t need to buy at the exact bottom. What’s more important is that we buy at a point where we can sell higher in the near future.
When to Buy
We want to do all our buying during the early and mid stages of a bull market, after a pullback. Before we buy, the following conditions should be met:
We are in a bull market according to timing and price shows correlation with our lagged M2 metric.Bitcoin’s price has had a pullback, as has the lagged global M2 metric, and the lagged M2 shows a strong push to the upside that lasts for multiple weeks ahead, starting at or around the time we intend to buy.Bitcoin’s most recent correction appears to have played out.Lagged M2 forecasts strong rally ahead
To determine whether Bitcoin’s correction has played out, we have to look closely at the pullback. If it was largely sideways, that’s a bullish pattern, meaning the correction has likely already played out.
If price made a tall, strong spike down last, there is a high chance that there will be an additional, weaker leg down to a new lower low before price is ready to rally again.
For altcoins, we will simply buy and sell based on our strategy using the Bitcoin chart and lagged M2, without overanalyzing individual altcoin charts. Once Bitcoin rallies aggressively, correlation will do its thing and drive altcoin prices up. Analyzing individual altcoin charts can still be useful for identifying which altcoins are likely ready to rally strongly alongside Bitcoin and potentially outperform.
What to Buy
The most obvious and safest bet in crypto is Bitcoin. Bitcoin should be a large part of anyone’s investment portfolio. In the very long term, Bitcoin has outperformed every altcoin out there. However, due to its already large market capitalization, Bitcoin can no longer make one rich overnight, even though it still delivers substantial gains. This is why many retail investors focus more on altcoins.
For altcoins, timing is much more critical than for Bitcoin. Some altcoins can quickly multiply one’s investment by a factor of 10, 100, or even 1000 in extreme cases. However, when Bitcoin drops or chops sideways for a prolonged period of time, many altcoins just go back down to where they started their rally or even lower, erasing all the unrealized gains of holders who didn’t sell in time.
When to Sell / Take Profit
Bitcoin purchased early in a bull cycle can generally be comfortably held until the cycle ends. Unlike most altcoins, Bitcoin’s corrections during bull markets are shallow, with relatively little drawdown.
For our altcoin holdings, it’s often better to hold them only during one of Bitcoin’s aggressive expansion phases, then sell at least a large portion, with the intention to buy back in if the buy conditions we discussed earlier are met again. We should especially take profits aggressively on altcoins where we are significantly in profit. This may seem counterintuitive, as many traders tend to fall in love with projects that show them large green numbers, even though it’s only unrealized profits, until they sell. However, the reality is that a specific altcoin narrative often only shines once in a bull market and in the next run up after a prolonged correction, different altcoins will take the spotlight and deliver the big gains.
For our strategy, we want to sell all or most of our altcoin holdings whenever our lagged M2 metric starts to move sideways or pull back. We want to hold altcoins only during the period in bull market when the lagged global M2 metric is aggressively spiking up. We also want to sell our altcoins and at least most of our Bitcoin if we identify the end of a bull market.
Backtesting Our Strategy
Time to backtest our strategy over the course of the last two bull markets. For our backtest, we will simply buy whenever the lagged M2 metric is at the exact bottom of a V-shape and a prolonged bullish spike follows.
2023 to 2025 overview202320242025201920202020 to 2021late 2021
Let’s also look at a few altcoins to see how we would have performed there.
ETH 2023 to 2025SOL 2023 to 2025PEPE 2024 to 2025
As we can see, our performance would have been quite good. Keep in mind that the final sell sign after each bull market is no longer based on the lagged M2 metric alone, but simply on how long the bull market has already lasted. In addition, visible exhaustion of trend and price struggling to keep up with lagged M2 reinforce the expectation of a bear market.
For a detailed breakdown of how Bitcoin’s last cycle top was predictable using pure price action analysis, make sure to read my previous article on identifying reversals.
Is Futures Trading Recommended for Beginners?
Trading futures is tempting because it opens up the possibility of making money even during bear markets. It also allows us to use leverage to potentially amplify our gains even further. However, futures trading is generally riskier than spot trading because it involves the risk of liquidation. Leverage does not only amplify our gains, but also our losses. Futures trading requires a great deal of discipline and strict risk management.
Even though we have to admit that spot trading risky altcoins can also cause significant losses, if it’s done badly, trading futures is still quite a bit more difficult. In my opinion, futures trading is more suitable for advanced traders rather than beginners.
Are Trading Bots Recommended for Beginners?
There is one particular trading bot that I highly recommend for beginners and that is a rebalancing bot.
On the Pionex exchange, rebalancing bots can be launched starting with as little as 10 USDT per coin. A rebalancing bot holds only spot crypto and bears no risk of liquidation. It strongly profits from volatile sideways price action as well as uptrends. It is especially useful for highly volatile altcoins that are difficult to time manually, like memecoins for example.
My favorite way of using rebalancing bots on risky altcoins is by creating a separate bot for each altcoin with 70% allocation to the altcoin and 30% to a stablecoin such as PAXG or USDT. This way, the bot works somewhat like a grid bot but without liquidation risk, and it cannot get out of range either. It takes profits little by little when price rises and buys back lower during pullbacks.
A short-selling futures grid bot on the BTC/USDT trading pair with low leverage can also be a viable option during bear markets. It should be launched when price is at a range high inside a newly formed trading range and a stop loss should be set just above the highest grid level.
Grid bots on Pionex can be launched using AI settings, which are usually quite good. A stop loss must be added manually.
If you want to apply the strategies discussed in this guide, you can do so on the exchanges listed below.
Pionex is an exchange that specializes in trading bots. Using this link to sign up will grant you 5% discount on all trading fees. Alternatively, you can enter the referral code 0RM4B6PJzyt manually during sign-up.
Trade anonymously on LBank, a well-established crypto exchange without mandatory KYC verification. Using this link to sign up will grant you 5% discount on all trading fees. Alternatively, you can enter the referral code 5UABD manually during sign-up.
If you found this guide helpful, you may also follow me on Substack, where I plan on posting more frequent, time-sensitive market updates in the future.
I’m happy to answer questions and hear different opinions in the comments. Thanks for reading and good luck with your trading!
When to Buy and Sell Crypto: A Beginner’s Guide to Market Timing was originally published in Coinmonks on Medium, where people are continuing the conversation by highlighting and responding to this story.