
Bitcoin (BTC) entered 2026 with a strong start, showing more than 7% gain over the past week. The asset is at around $93,600 at press time, rising 1% in the last 24 hours. Daily trading volume remains high at $51.5 billion.
On Tuesday morning, Bitcoin climbed to its highest level in nearly two months, nearing the $95,000 mark. Unlike previous moves, the weekend rally held through Monday, a change from recent patterns where gains were often erased quickly.
Price Moves Toward Key Resistance
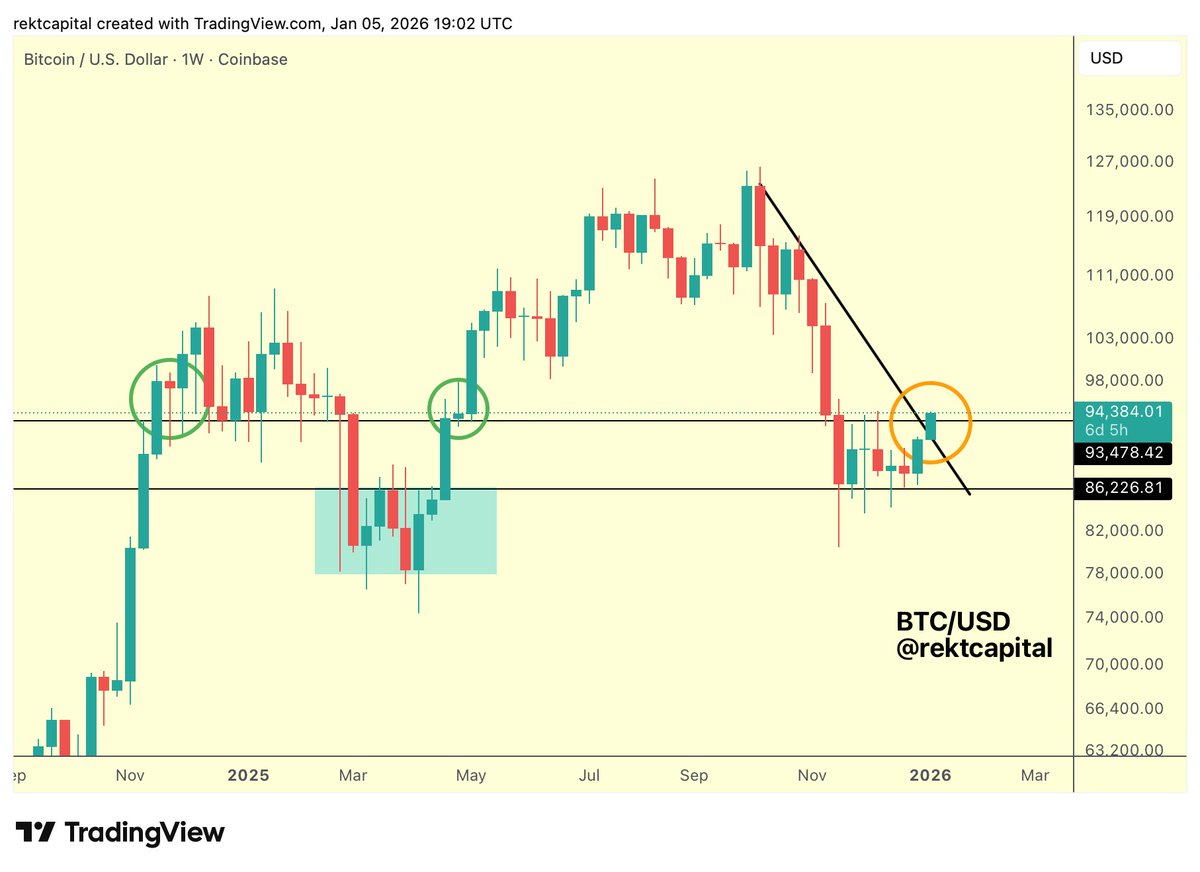
Bitcoin has rebounded from the lower end of its weekly range near $86,200. This level has acted as a support area in the past. The price has now climbed to test the top of this range near $93,500. Analyst Rekt Capital pointed out that a close above this level would mark a potential breakout. The asset is currently trading above the range high, but the weekly close will be crucial.
Notably, the move also comes as BTC breaks above a downtrend line that has been in place since October 2025. This trendline, drawn from lower highs, has now been breached. Holding above $93,500 is seen by many traders as the level that could shift the mid-term picture.
“$93,500 needs to hold as support for mid-term bullish bias,” said Rekt Capital.
Bitcoin (BTC) Price Chart 6.1. Source: Rekt Capital/X
Despite recent gains, market analysts remain cautious. Rekt Capital noted that Bitcoin closed its 12-month candle below $93,500. Based on historical cycles, similar levels have remained unbroken for several years until the next halving year.
“If indeed Bitcoin has begun a bear market, price could overextend beyond $93,500 over the coming months… before continuing lower.”
Sykodelic, another market analyst, pointed to strong buying activity driving recent gains. They noted a breakout in the On-Balance Volume indicator and mentioned that Coinbase is showing signs of a spot premium. Still, they added a caution:
“We need to get above and hold $94.5K. If not, we may revisit $89K.”
Macro Trends May Be Shifting
Analyst Lark Davis drew attention to a technical crossover on the US Federal Reserve’s balance sheet. A monthly MACD golden cross has formed, which last occurred in 2019. At that time, Bitcoin began a major rally in the months that followed.
“Not official QE yet… but it sure looks like QE and smells like QE,” Davis said.
The crossover suggests the Fed’s balance sheet may be expanding again after months of decline. This shift in liquidity may affect markets in early 2026, especially risk assets like Bitcoin.
Support Levels and Market Outlook
Michaël van de Poppe identified the $90,000–$91,000 range as a short-term level that needs to hold. This zone also lines up with the 21-day moving average. A failure to hold could lead to a retest of lower levels.
“If that holds and a higher low forms, then we could be looking at $100K,” he commented.
Data from Glassnode shows that Bitcoin is recovering from a correction. The current phase is described as a consolidation, though market conditions remain uncertain. While many metrics are turning positive, some analysts believe this rally could be the final leg before a larger move down.
The post The Final Barrier? Why This Key Level Will Decide Bitcoin’s Fate appeared first on CryptoPotato.