ETH is trying to build a short-term recovery, but the chart still reflects a market trapped under heavy macro resistance.
The price is attempting to push through a clean trendline that has capped every rally since early October.
Momentum is improving, but buyers still need a decisive break above the $3,500 area to shift the structure. Until then, every move higher remains vulnerable to rejection.
Technical Analysis
By Shayan
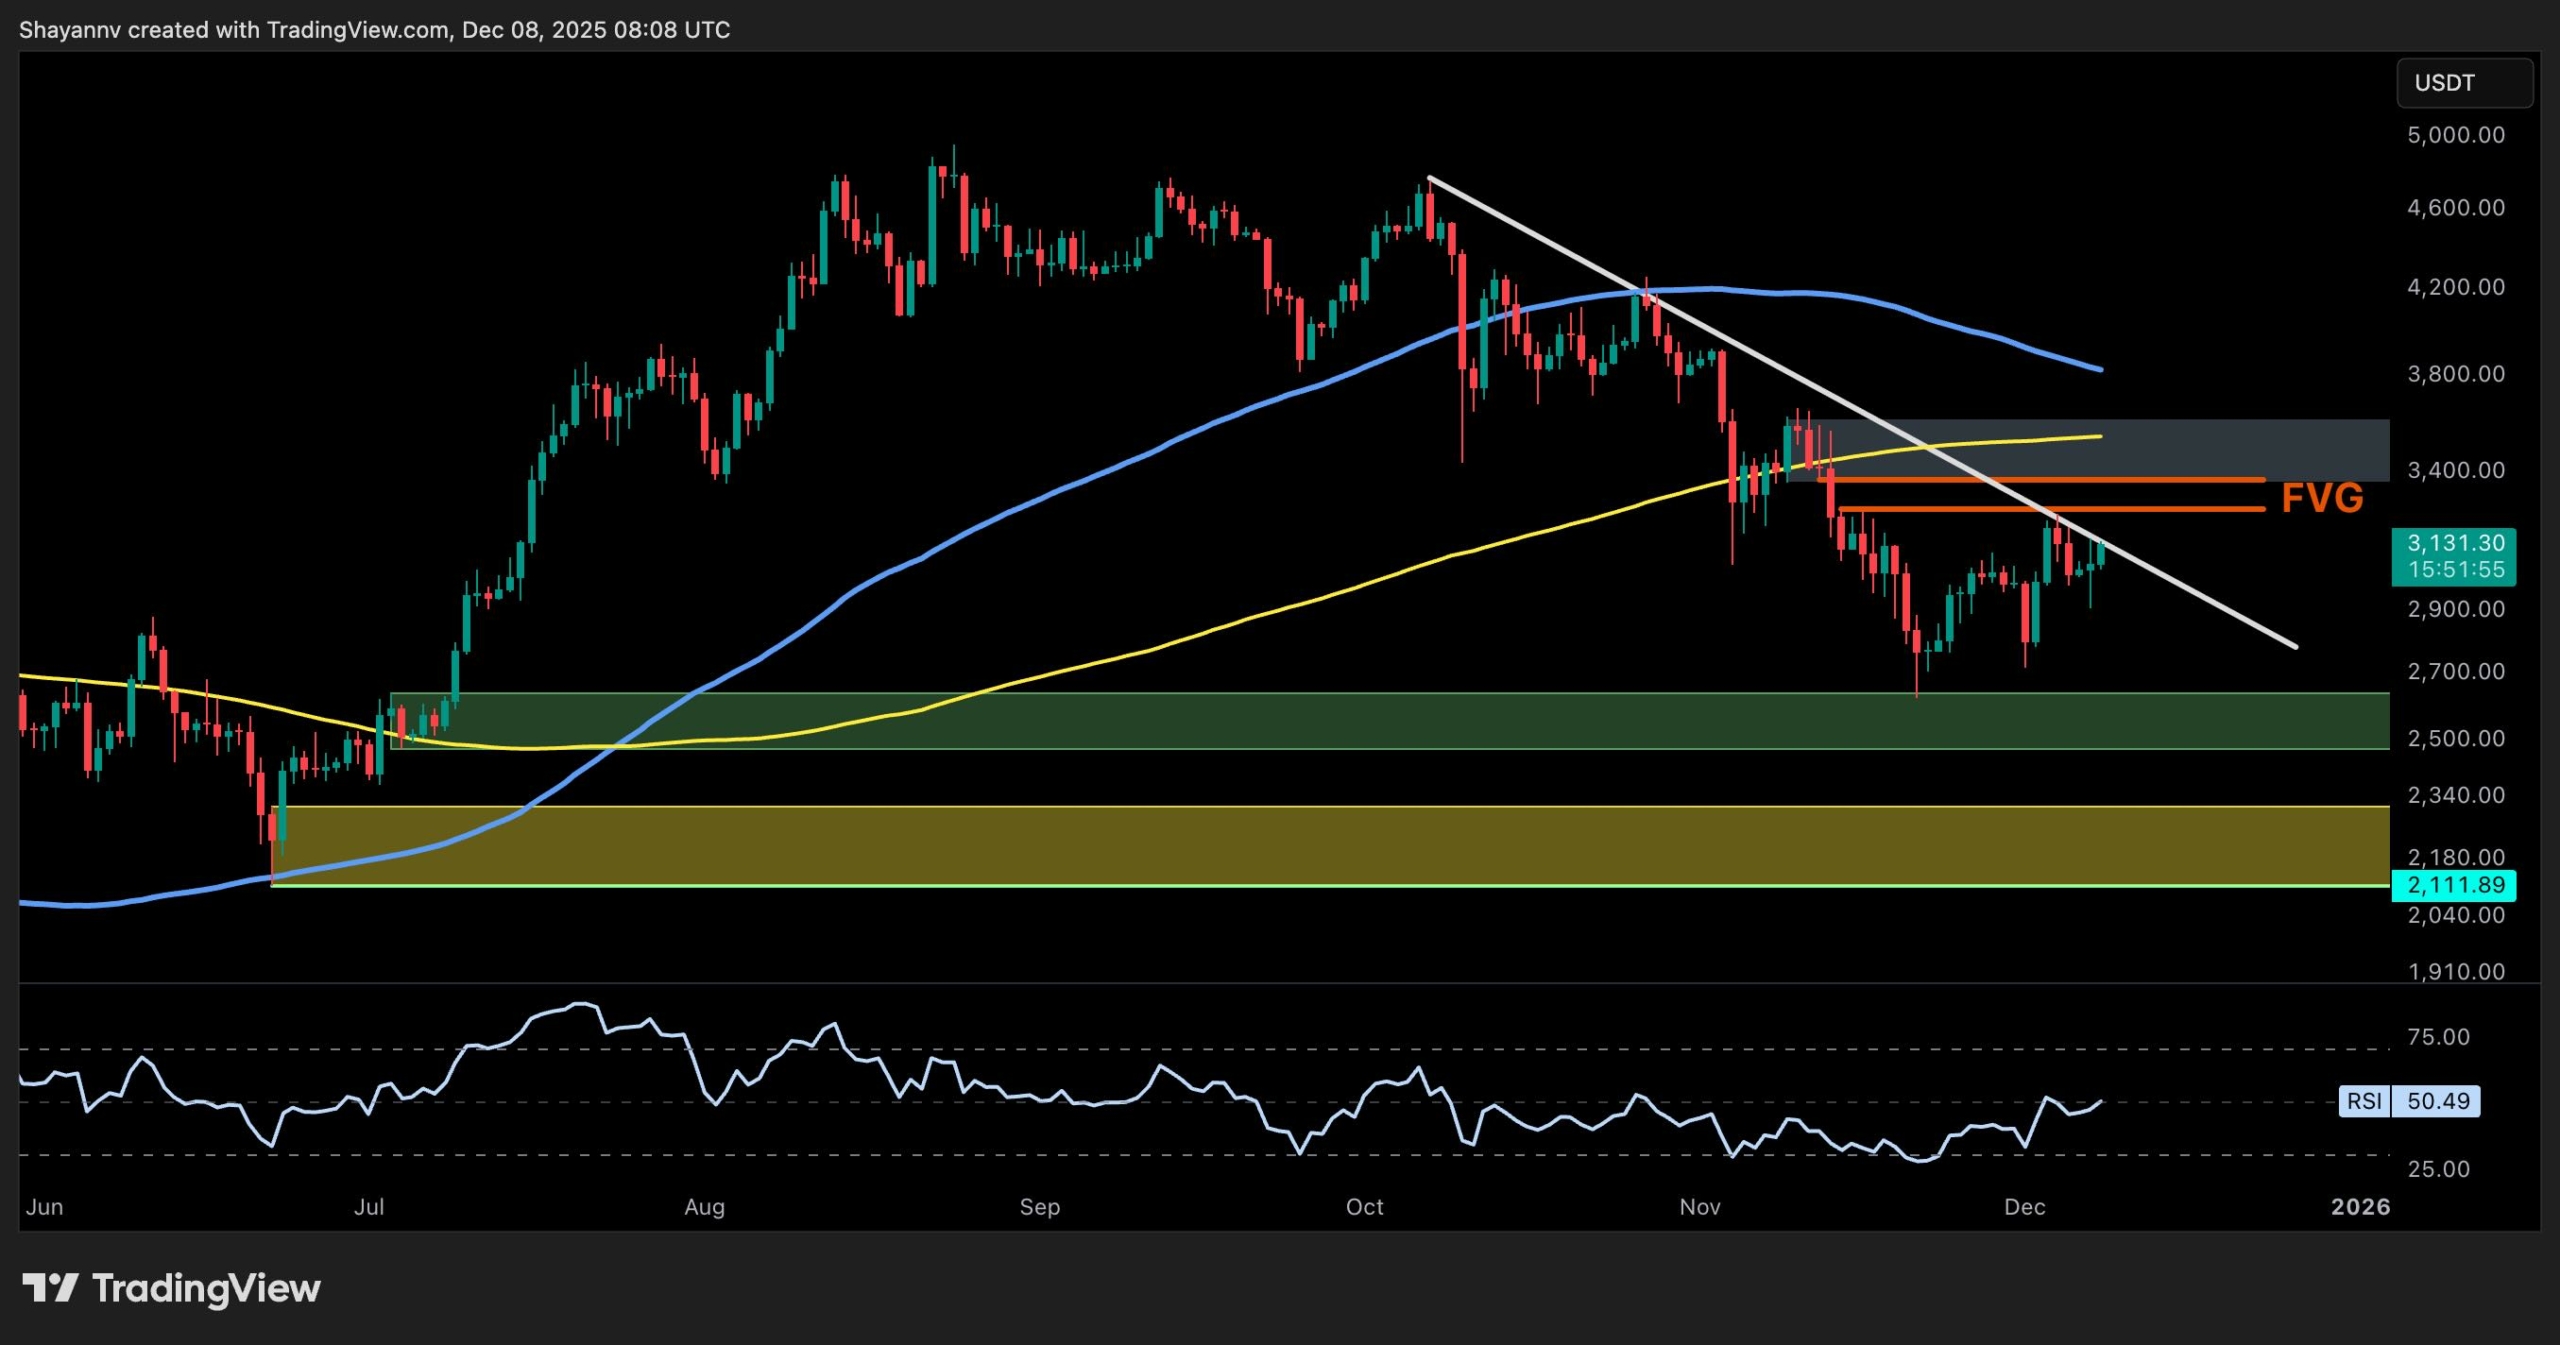
The Daily Chart
On the daily chart, ETH continues to respect the descending trendline while still trading well below the 100-day and 200-day moving averages, located around the $3,600 mark. This keeps the broader bias bearish, even though the price is slowly recovering from the capitulation low around 2.7k.
The critical region remains $3,400-$3,500, where a key Fair Value Gap and bearish order block sit. If ETH can break and close above that level, it could signal a move toward the $4,000 zone.
Support levels remain cleaner. The $2,900 short-term level held multiple times, and below that, $2,500 and $2,200 areas are the strong demand zones. As long as ETH stays above $2,900, buyers have a base to work with, but they still need a new higher high to confirm trend reversal.
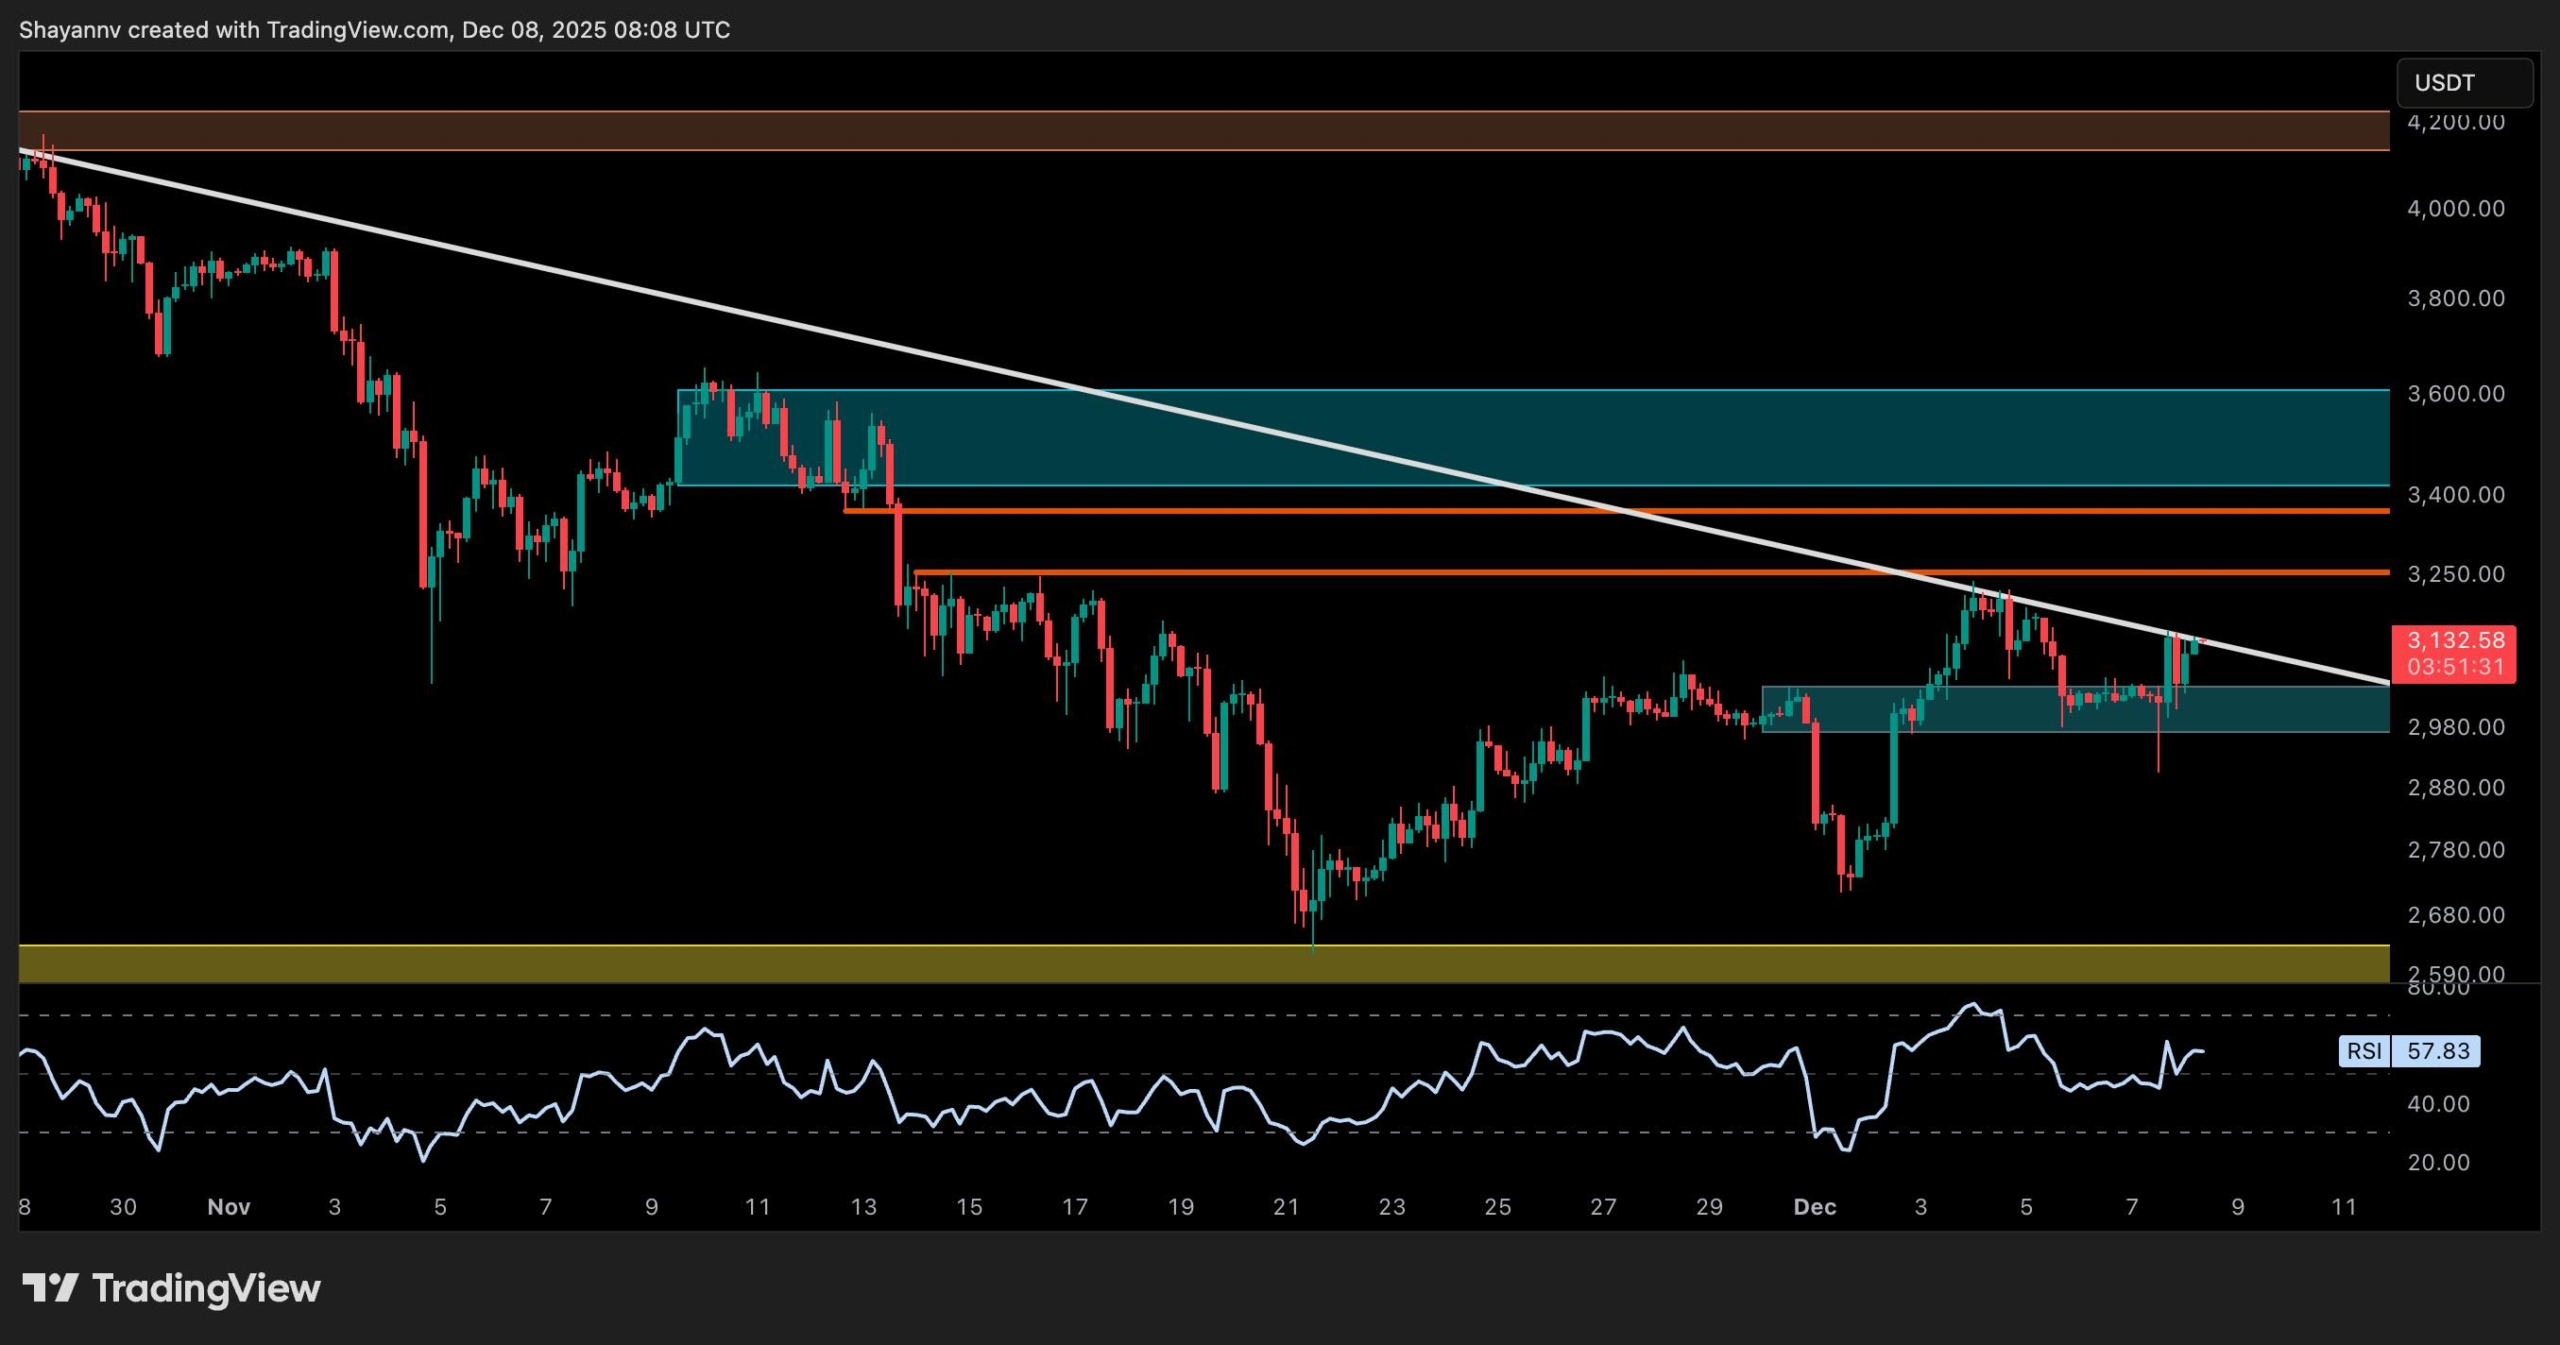
The 4-Hour Chart
The 4-hour chart shows ETH pushing into the descending trendline again after defending the $2,900 zone. This range is clearly acting as short-term support, but buyers haven’t shown enough strength to reclaim the $3,200 recent high. The RSI is also mid-range, showing no exhaustion, but also no strong momentum.
A rejection here sends ETH back toward $2,900 for another test. A clean breakout above $3,200, followed by a retest, would be the first real sign of bullish continuation. Without that, ETH simply remains stuck under trendline compression, and the risk of another liquidity grab to the downside stays open.
On-Chain Analysis
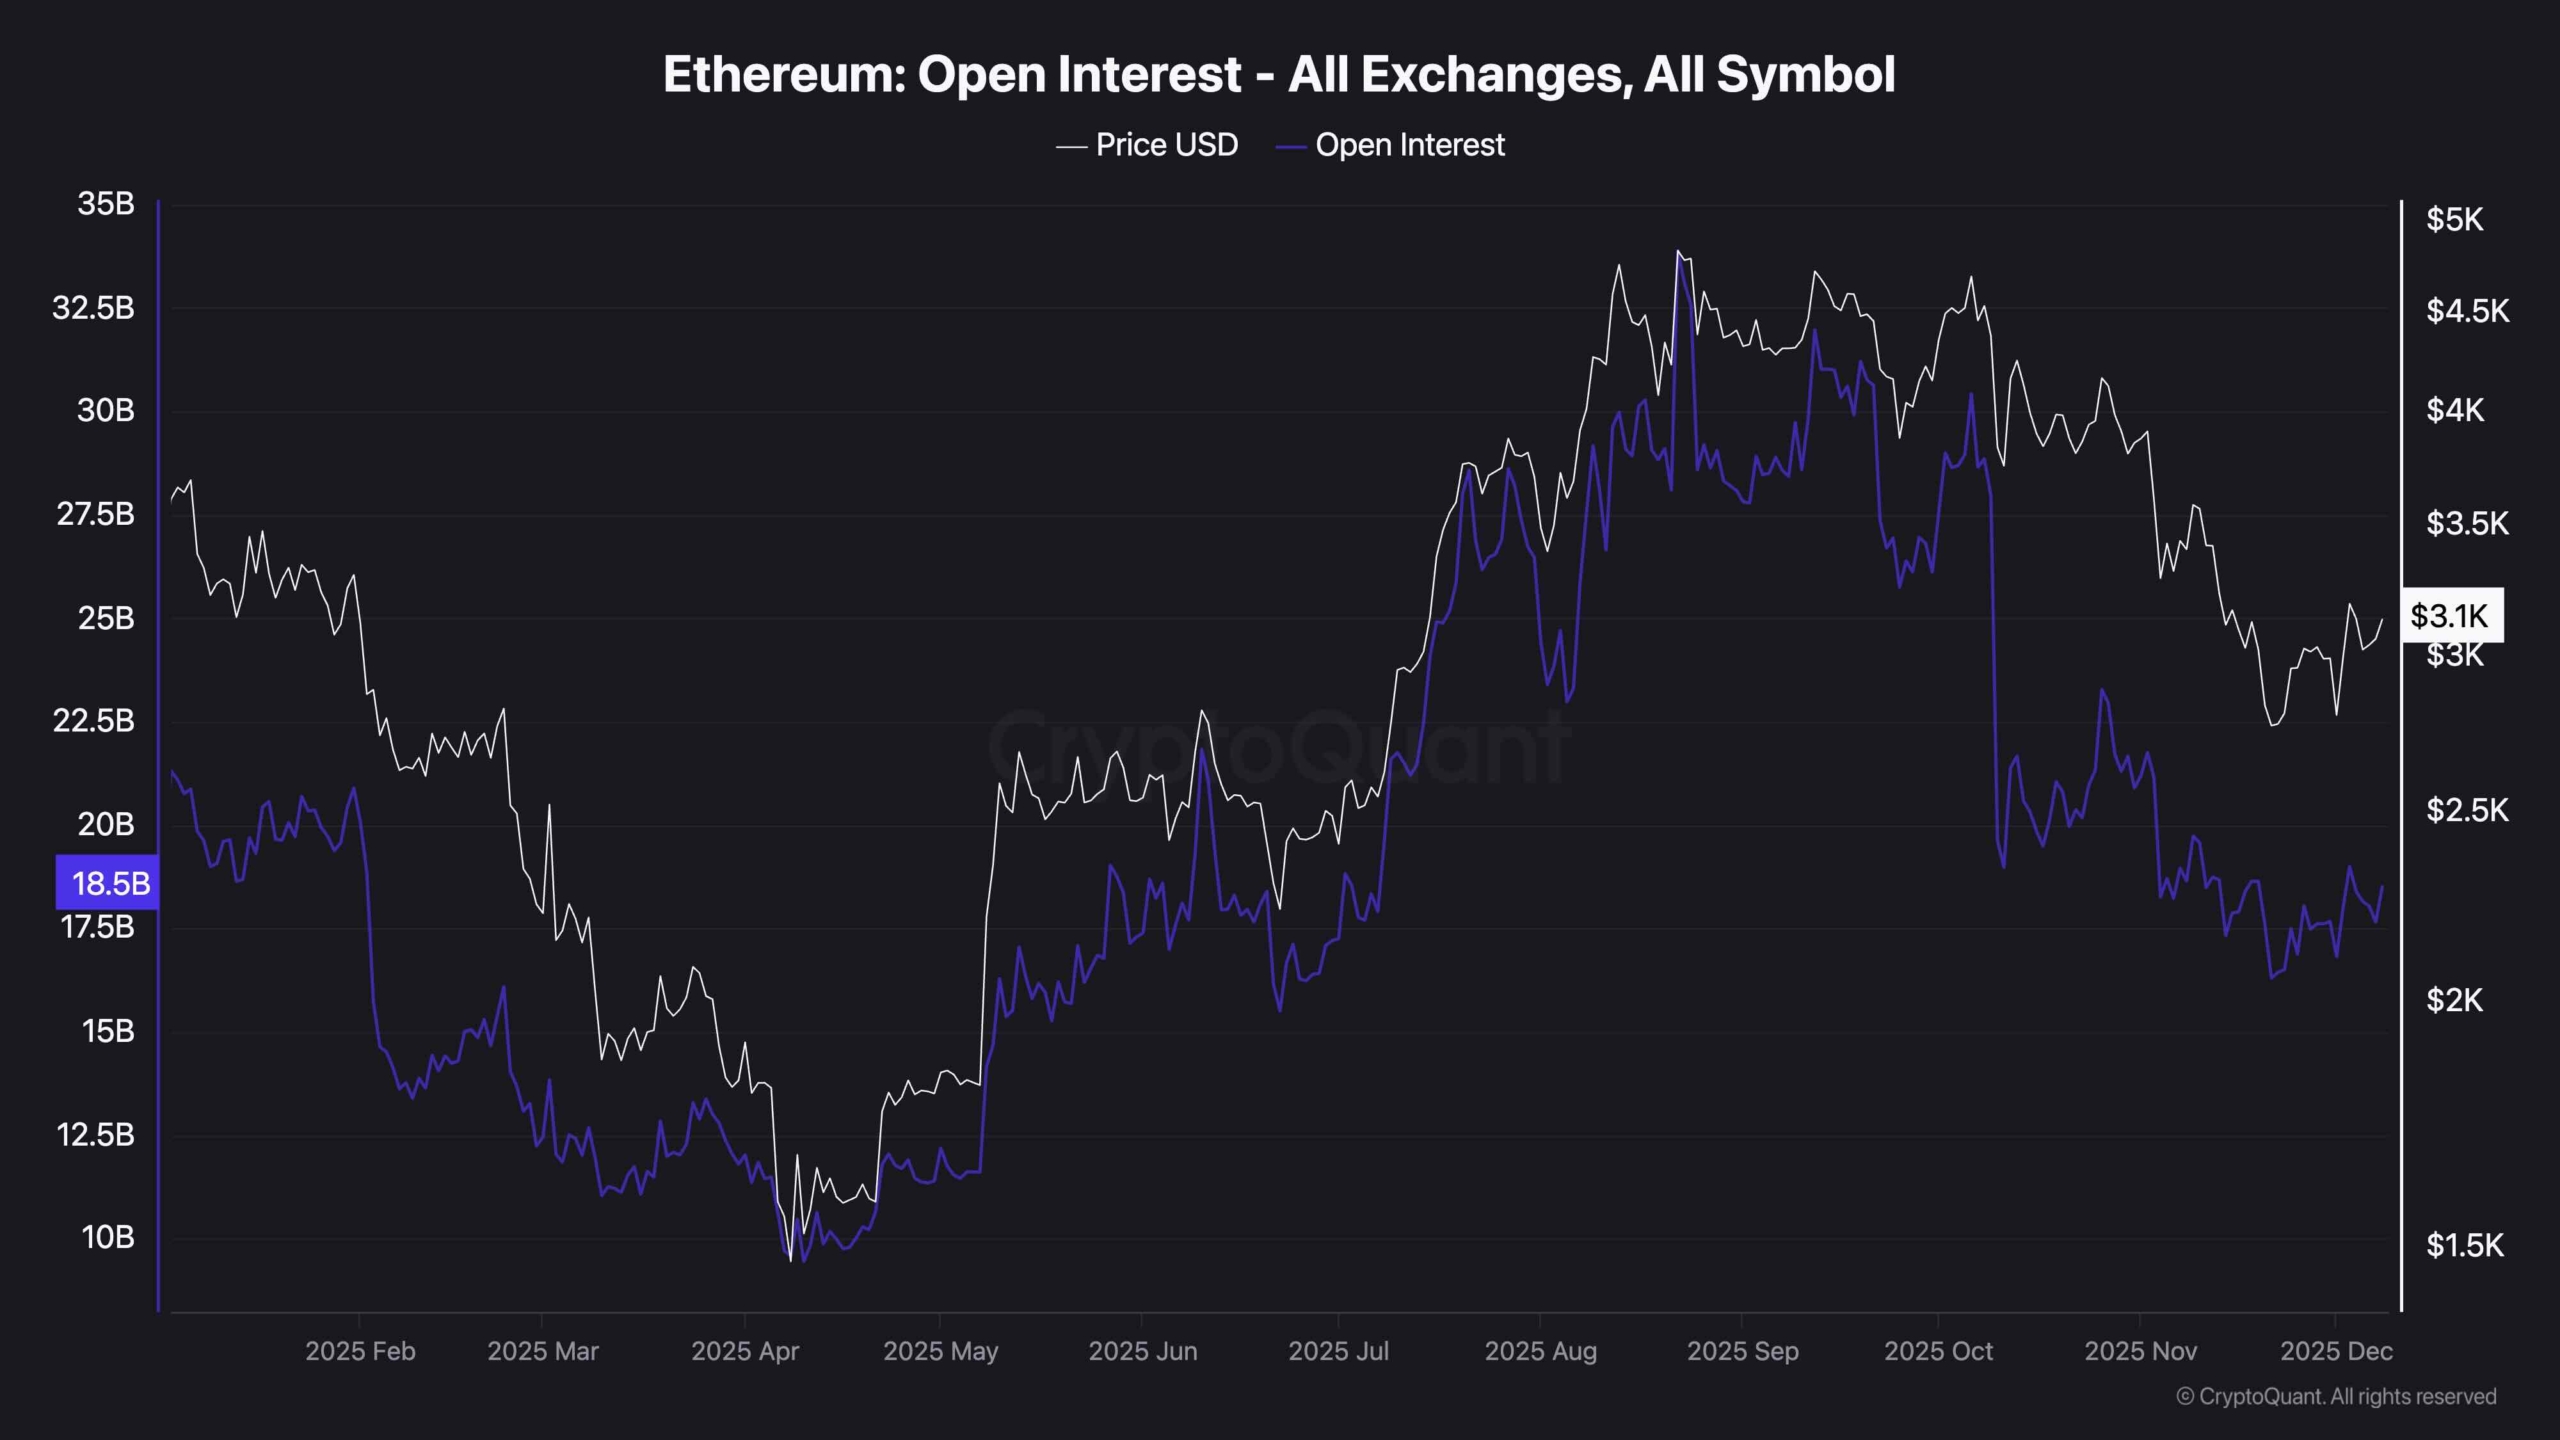
Open Interest
Open Interest has been declining since September, while the price has also pulled back from the highs, indicating clear risk-off behavior. The most important part is that OI has not expanded during this recent bounce. That usually signals a lack of aggressive long positioning. Traders are cautious, not chasing the move, and still unwinding positions from the earlier rally.
This kind of sentiment can actually fuel a stronger breakout later, because rallies that begin on low leverage tend to be healthier. But for now, it shows that the market doesn’t fully trust the upside. A quick spike in OI during a trendline breakout would confirm real participation returning. Until then, ETH remains in a neutral-to-cautious sentiment phase.
The post Ethereum Price Analysis: ETH Attempts to Recover Above $3.2K But Are the Bears Done? appeared first on CryptoPotato.