
Bitcoin’s recent price surge toward $66,000 has led to heightened optimism, but the market now faces a potential retracement phase.
The $66K resistance level is proving to be a formidable barrier, and BTC is likely to undergo a period of consolidation or correction before determining its next major trend.
Technical Analysis
By Shayan
The Daily Chart
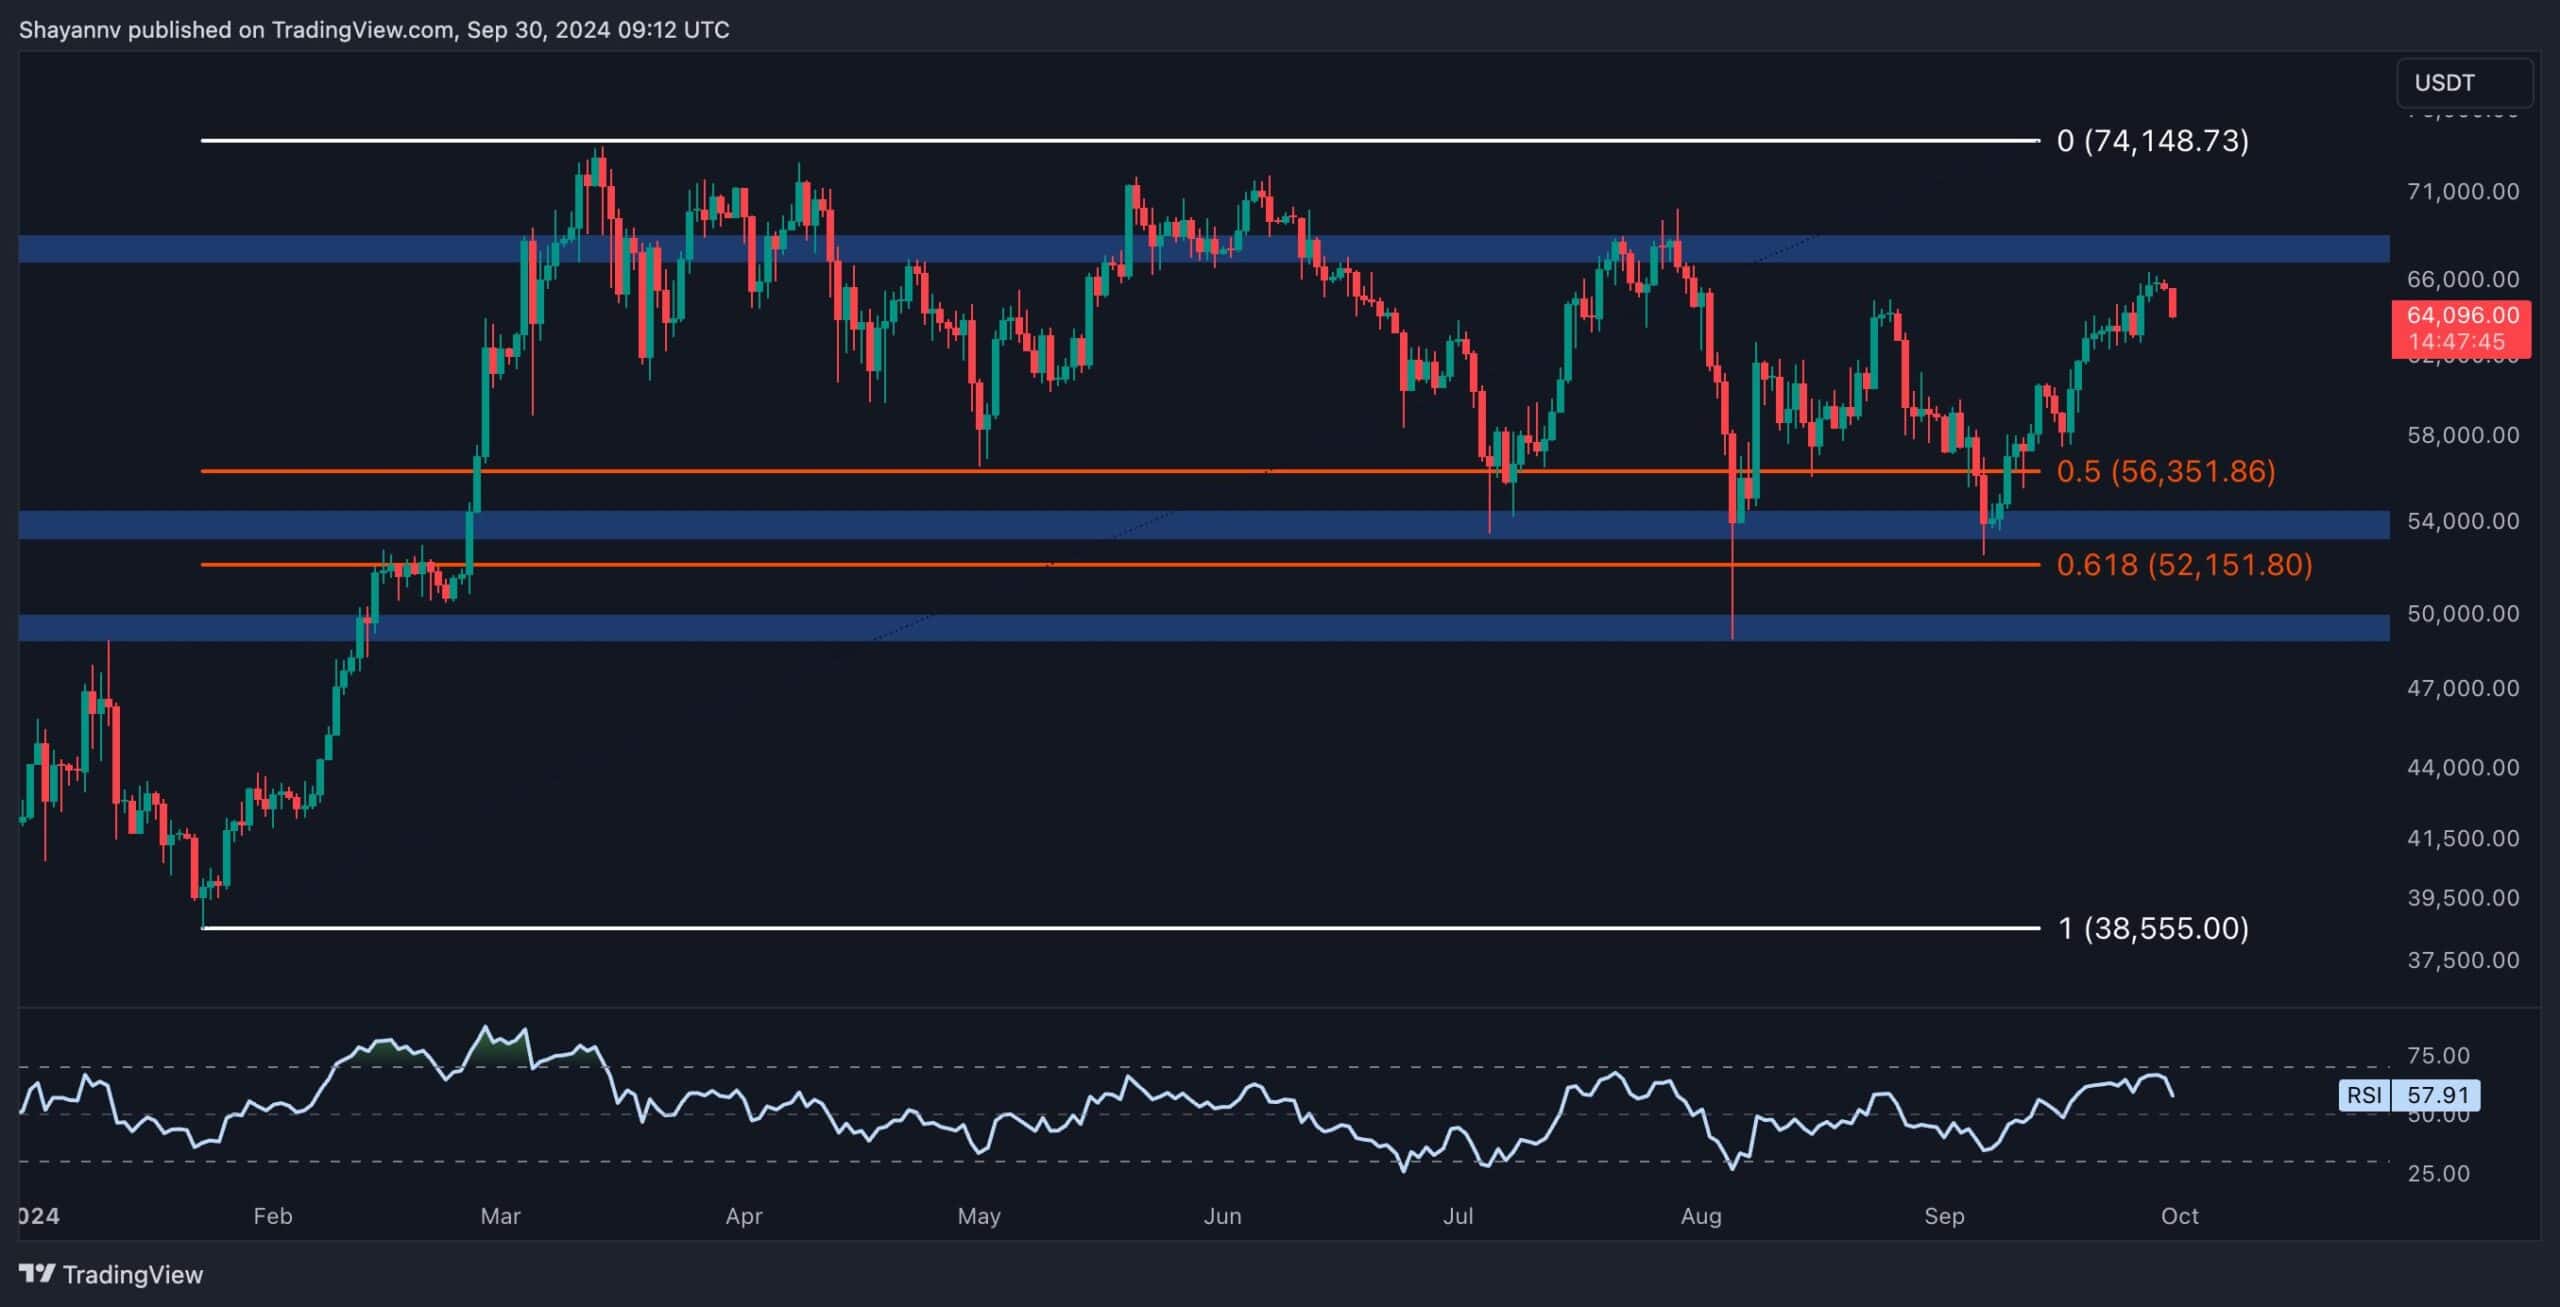
Bitcoin recently experienced a strong bullish surge, reaching the critical $66K resistance region after originating from a significant support level of around $55K.
This bullish momentum was driven by improved market sentiment and buying activity. However, upon nearing the $66K threshold, Bitcoin’s price faced considerable selling pressure, leading to a slight rejection.
This range represents a significant resistance level that aligns with BTC’s previous major pivot. Notable supply could be sitting there, thus offering a strong barrier against further increases. Given the impulsive nature of the recent upward movement, a period of corrective retracement is likely as the market cools off before determining its next major trend direction.
The 4-Hour Chart
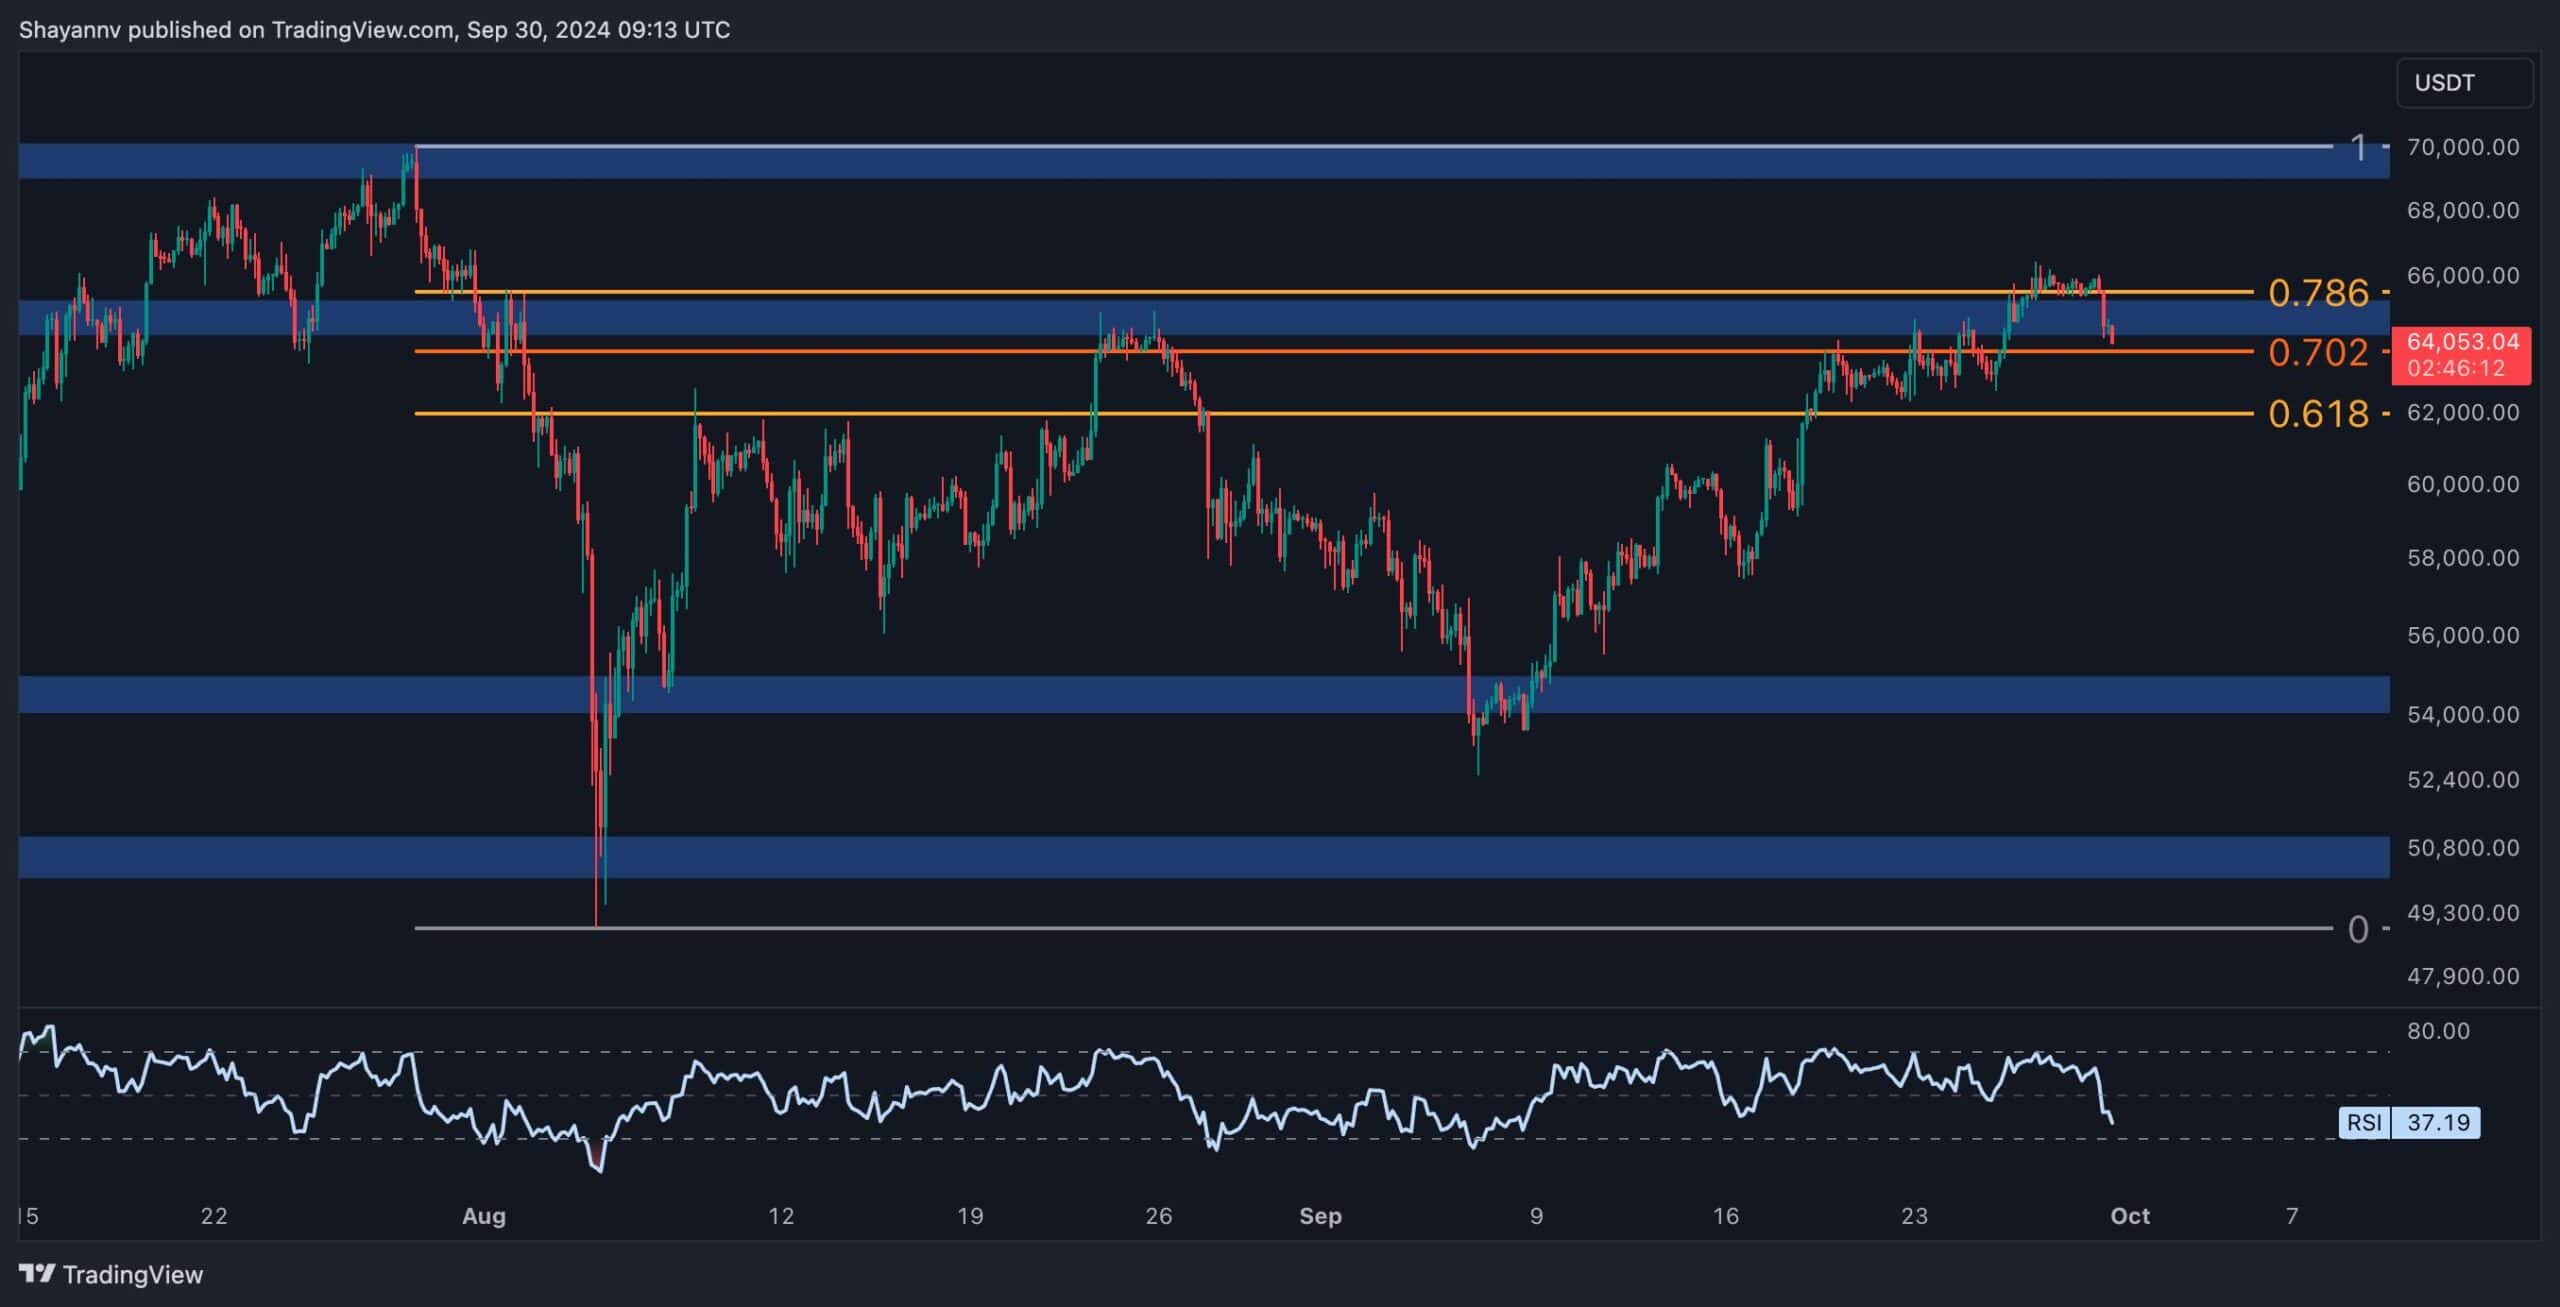
On the 4-hour chart, Bitcoin’s recent price action reveals a pattern of higher highs and higher lows, forming an upward trajectory from the crucial $55K support zone. This demand surge resulted in Bitcoin reclaiming the $65K swing high, triggering a short-squeeze and drawing liquidity from the resting sell orders in that area.
Currently, the price has reached the zone between the 0.618 and 0.786 Fibonacci retracement levels, also known as the Optimal Trade Entry (OTE) levels. This region often acts as a substantial resistance level, and Bitcoin has already encountered heightened selling pressure, leading to a slight rejection from this range.
Given the current market dynamics, Bitcoin is likely to enter a short-term corrective retracement phase, with the primary target being the $60K psychological support level. This temporary pullback would allow the market to digest the recent gains before potentially resuming the uptrend.
On-chain Analysis
By Shayan
As Bitcoin’s price continues to climb towards the $66K level, a closer examination of the Binance liquidation heatmap reveals the underlying dynamics driving the market’s behavior. The heatmap highlights the critical liquidity zones influencing the price action.
$50,000 is a crucial support zone, as evidenced by the substantial liquidity below this threshold. This liquidity represents stop-loss orders and liquidation levels, predominantly from larger market participants, including whales. On the other hand, the $66K-$70K range is another crucial liquidity pool. The heatmap shows significant liquidity concentrated in this zone, representing an area with larger sell orders, stop-loss triggers, and potential liquidation prices.
Currently, Bitcoin’s price is confined within two prominent liquidity zones. On one end, $50K is heavily defended by whales and larger market participants, preventing further declines.
Conversely, the $66K-$70K resistance presents a significant barrier due to the concentration of liquidity. In a broader sense, Bitcoin is trapped between these two critical levels, and a breakout from either side could lead to a liquidation cascade that amplifies the prevailing trend.
The post Bitcoin Price Analysis: BTC Tumbles to $64K as Bears Look to Reappear appeared first on CryptoPotato.